ClickHouse and Kubit are a match made in data heaven. Together, they form a powerful combination that enables fast, efficient, and scalable analytics for modern businesses. In this guide, we’ll explore how ClickHouse’s architecture works seamlessly with Kubit’s customer analytics platform, enabling you to leverage the full potential of your data.
ClickHouse Architecture Overview
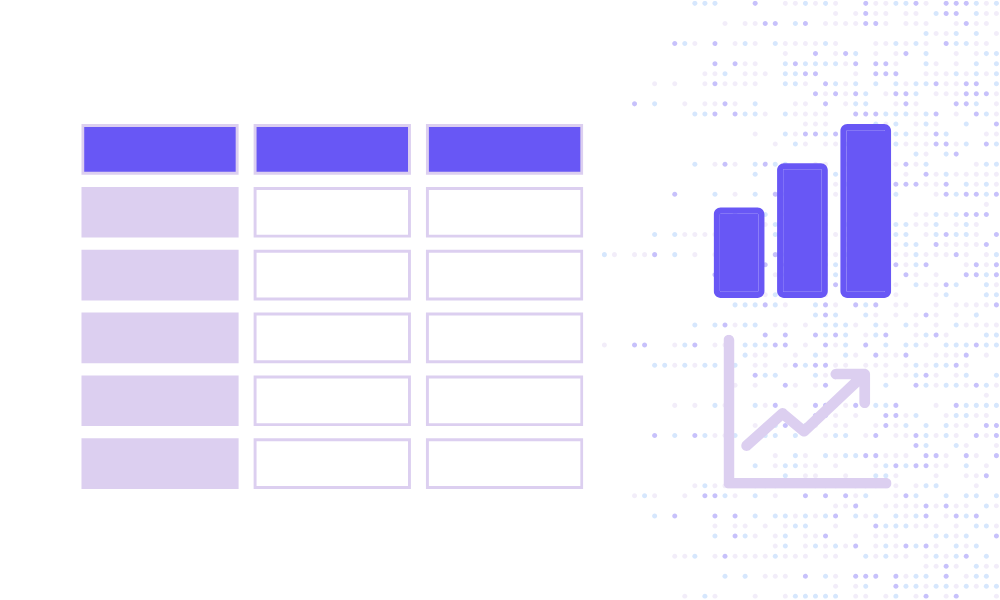
ClickHouse is a columnar database management system (DBMS) designed for online analytical processing (OLAP). Its architecture is optimized for handling large-scale data queries, making it ideal for big-data applications.
Some key features of ClickHouse’s database architecture include:
Columnar data storage for faster query processing
Parallel execution for scalability and speed
Compression techniques that reduce storage costs
These features ensure that Kubit’s analytics platform performs at top speed, handling complex queries with ease.
How to Optimize Your ClickHouse Queries
To get the best performance from ClickHouse, especially when integrated with Kubit, it’s crucial to understand ClickHouse internals. This deep understanding allows you to optimize query performance by focusing on:
Using partitioning to break down large datasets for faster query response.
Optimizing index usage to narrow down the search space for queries.
Batch inserting data to avoid frequent minor updates that may slow down performance.
At Kubit, we leverage these techniques to ensure your data queries are fast and cost-efficient.
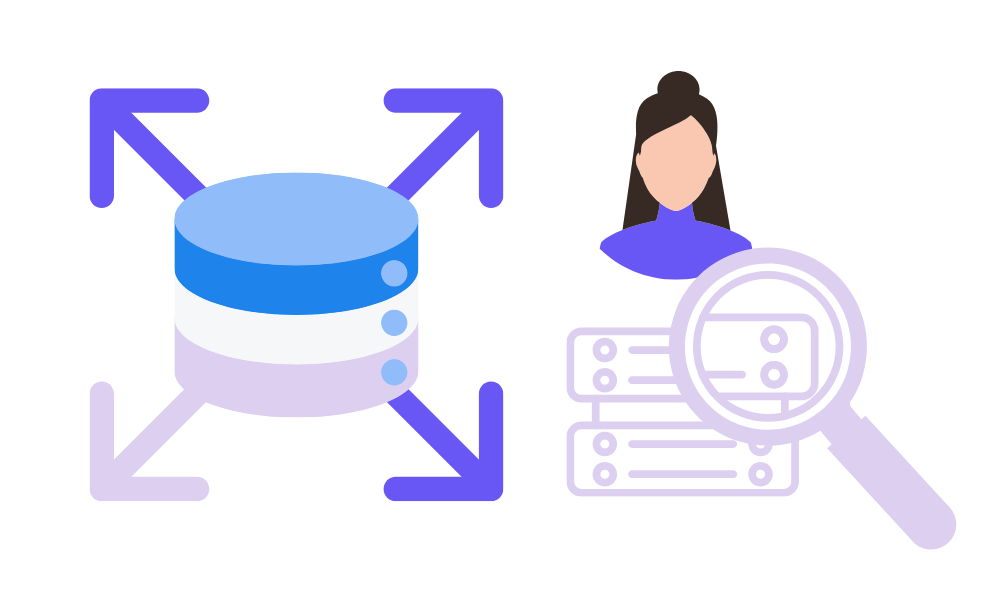
Benefits of ClickHouse’s Architecture
The architecture of ClickHouse makes it an ideal solution for businesses that require high-performance product analytics, such as those powered by Kubit. Its scalability allows it to handle millions of rows of data without compromising performance, ensuring seamless operations even at large data volumes. The system’s efficiency shines through with parallel query processing, delivering near-instant results for complex data sets. Additionally, the columnar storage format offers flexibility, giving businesses greater control over how their data is queried and analyzed to gain actionable insights.
These features help large-scale organizations democratize data, making it accessible to more teams across the business.
ClickHouse Use Cases
ClickHouse is the go-to solution for organizations that handle data from millions of users, particularly in consumer applications and high-volume SaaS products. Its performance is crucial for industries such as e-commerce and media, where businesses rely on real-time data to track customer behavior, and when capturing content performance and audience engagement is critical to driving user retention and growth.
SaaS companies use it to monitor product usage and engagement metrics at scale. Kubit leverages this power for both product and customer analytics, delivering fast, actionable insights that can be easily visualized in executive dashboards. This makes it the ideal platform for businesses looking to turn massive data streams into clear, strategic decision-making tools.
How to Get Started with ClickHouse
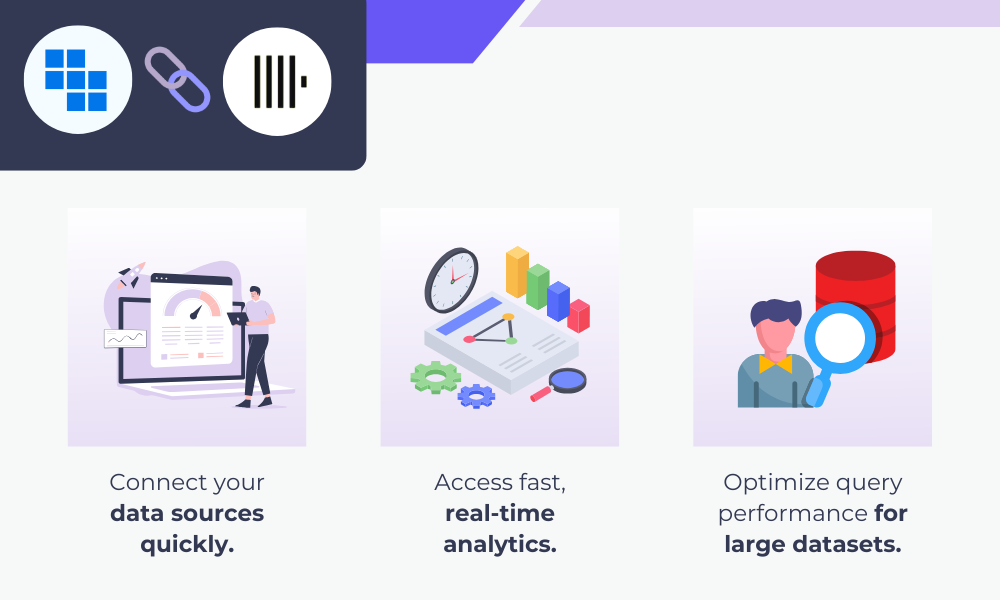
To begin utilizing ClickHouse with Kubit, simply integrate ClickHouse as your backend database for analytics. Kubit’s platform is designed to integrate with ClickHouse, allowing you to seamlessly:
Connect your data sources quickly
Access fast, real-time analytics
Optimize query performance for large datasets
With Kubit’s streamlined setup and expert customer success team, you’ll unlock ClickHouse’s full potential, effortlessly optimizing performance and scalability. Complex datasets become actionable, giving teams across your organization visibility into critical insights. This visibility allows for data-driven decisions and business improvements, empowering more of your team to operate effectively and align on strategic goals.
FAQs
What is ClickHouse?
ClickHouse is a columnar DBMS designed for fast query processing of large datasets in OLAP scenarios.
Which engine does ClickHouse use?
ClickHouse uses a MergeTree engine, allowing partitioning, indexing, and replication.
What language does ClickHouse use?
ClickHouse uses SQL as its query language, making it accessible to most data engineers.
What is a DBMS?
A DBMS (Database Management System) is software used to store, retrieve, and manage data.
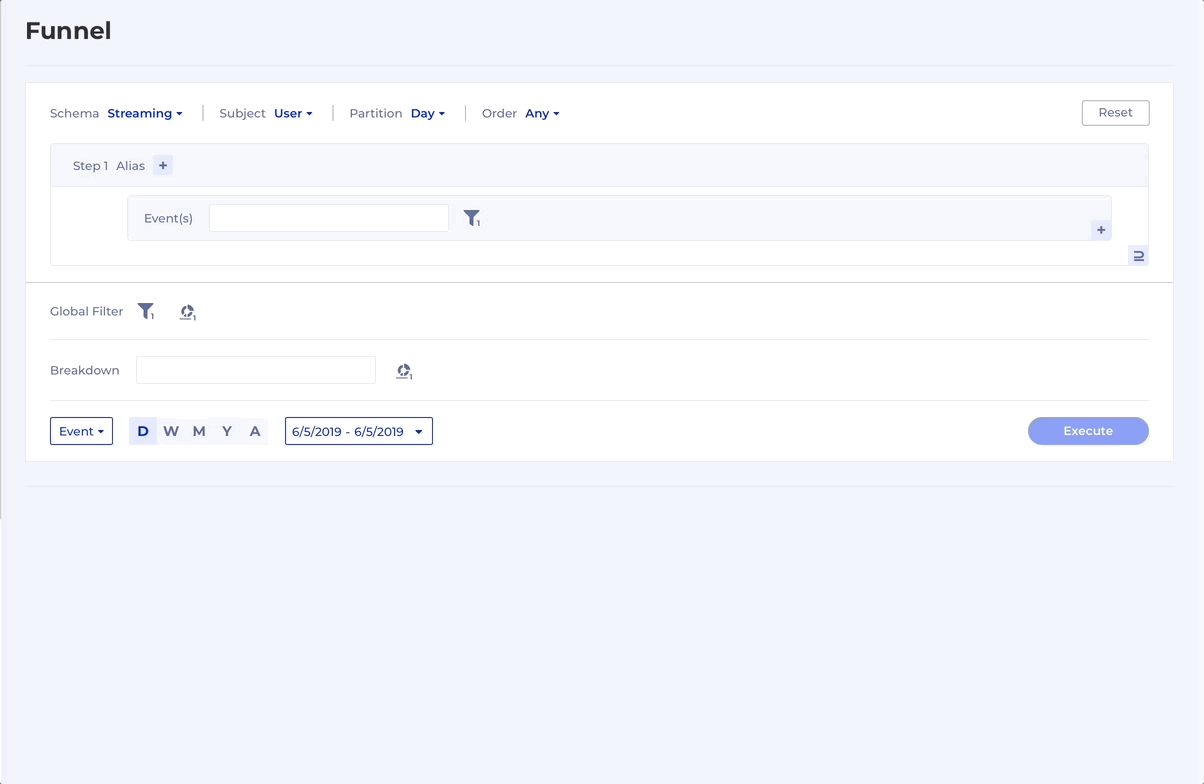
Funnel analysis is an essential way to observe and describe a customer journey as a process with different stages that users go through. It usually involves several steps, from entering an app or web page to performing a particular action. It is called a funnel because of its shape that becomes narrower and narrower. By observing your funnel, and analyzing and adjusting its parameters, you will be able to improve conversions and customer satisfaction.
The funnel is an excellent tool for marketers, product managers, sales, and data scientists to understand user behavior better. Whether you wish to convert visitors into customers or you want your customers to buy more of your products, or even make them stay more in your app, funnel analysis is essential. Having a good understanding of your funnel is like using a GPS to guide you to a place you want to visit. It will show you the speed, the direction, and whether you’re on time or going to be late.
Conversion rates can help you understand the number of visitors who came to your website and bought a product or performed an action, such as watching a movie, downloading a document or submitting a lead form.
Why Are Conversion Funnels Important?
In product analytics conversion funnels provide the means for teams to look at specific user journeys through different lenses. Conversion funnels are often used to understand where the drop-off points and areas of friction are and then to measure the effect of any improvements that are being made.
For example, let’s say your organization has a subscription-based business model and the main focus is to drive more subscriptions. Now this is a complex issue and usually there’s no obvious and straightforward answer, but funnels can help you start uncovering a solution. Here’s some typical questions to ponder:
Is the top of the funnel not wide enough?
Maybe users aren’t being asked to subscribe often enough?
Are our campaigns working as expected?
Is there a bug in the subscription workflow causing people to fail to subscribe?
Do people get stuck on repeating a certain step in the subscription flow?
Is the time to convert too long?
You may notice that some of these questions can lead to solutions in product, some in marketing and others in engineering. Customer journeys in the digital age are becoming more and more complex and as a result require more collaboration between marketing, product and engineering in order to get them just right. Measuring the conversion rates at each step of the user journey can provide the objectivity required in these discussions to help make better decisions.
Once you have a hypothesis you can establish baseline funnels and then run the experiments to measure the effect of your changes. Even better, once you have those funnels you can put them all on a dashboard and keep monitoring the conversion rates with every release to help you detect any anomalies or regressions. Now your teams can leverage all these insights to make data-informed decisions.
To sum up, conversion funnels are a powerful tool which can be leveraged to achieve multiple benefits:
better understand user behavior
define and optimize user journeys
run better marketing campaigns
improve collaboration between product, marketing and engineering teams
track the customer experience over time
How does funnel analysis work?
There are steps you would expect your visitor to take, from entering your website or mobile app to taking an action, such as making a purchase. With a simple funnel analysis, you can visualize your visitors’ steps to convert. Creating a funnel allows you to observe where exactly visitors or users are dropping.
First, you collect data through user tracking, SEO, email campaigns and other methods. Note that you need to have your data available and ready for funnel analysis. Then you define the steps that will be evaluated.
A simple funnel tracks how users convert from entering a landing page to checking out, or watching a movie, or another goal conversion. The funnel itself is usually presented as a bar graph. You will know where to look next when you see a decline or drop in your funnel. Usually, this is the time when an imaginary light bulb shines above your head. Understanding each step of the funnel and making necessary adjustments to see what works and what doesn’t will eventually lead to more conversions.
Funnel Analysis Stages
When creating a funnel there are a few things you need to consider.
1. What is the purpose of funnel analysis?
Our goal may be to generate more leads, to achieve more transactions, to make people more engaged with your product, or something else. If you provide a streaming platform maybe daily active users (DAU) are your focus. Maybe you just developed a new feature and want to encourage people to start using it or you made a tweak somewhere in a particular user flow and want to measure the impact. Did users get stuck on a particular step in a flow? How much time is it taking for them to complete registration, subscription, or payment? Is it perhaps too much?
Whatever your goal, the purpose of funnel analysis is to allow you to identify all the critical touchpoints and measure the user’s journey through them. Once you have the measurement you can start making changes and quantify their impact.
2. What is the conversion rate you expect?
This is your benchmark to work from. And at first it can sound like a chicken and egg problem – which comes first – the funnel or the expected conversion rate? But in reality If you don’t have a funnel already it is very hard to have a well informed expectation.
Let’s say you’ve finished an outstanding marketing campaign. You forecast a significant increase in conversions. What will your funnel look like? You can compare older funnels, say Q1 is your benchmark and you compare to Q2 sales. Now you can measure if there is an improvement or not and by how much. If, for instance, you’re starting a business in a new country, you can correlate conversion rates. Or you can compare conversions between different versions of your app after every release. If there is a sudden drop maybe there is a non-obvious bug which made it all the way to production?
Over time you may also discover that there is a seasonality to your business or there are trends happening on a daily/weekly/monthly level. This all goes to say that conversion expectations are always dependent on some additional context which the analyst brings to the table.
3. What could you improve to raise the conversion rate?
In other words – how can you optimize your conversion rate? Maybe an ad campaign, discount offers, introduction of a new product or new service, additional benefits. Should they do the work?
You can A/B test your theories with real data examples and measure the significance of the experiments. Drill-down the different segments of users and how they compare and laser-focus on very specific user groups to target your improvements. Maybe one demographic isn’t responding to the ad campaign or is struggling with the adoption of a new feature? Or is it a country-specific issue which is positively impacted by your changes? You should use the improved results to achieve your goal. You can embed the analytical steps in your iterative process of bettering your product – just keep comparing funnels from different user segments as part of your release cycle to get a deeper insight into what the next step should be.
Sometimes your customers don’t follow the path you have created for them. Users can enter your funnel in a variety of different ways. That’s why it is important to define your funnel. There are a few types of funnels:
Open funnel – where users could enter any step and still be counted in the analyses
Closed funnel – to be counted, a user should go from step 1 to step 2 to step 3, and so on. But there might be other steps, for example, between seeing a product and buying that product, a visitor might read a blog, compare products etc.
Strict funnel – as the name says it means there are no other steps between the steps you define and if the visitor is not following that route, he won’t be counted in the analyses.
Do’s and Don’ts of Funnel Analysis
Funnel analysis shows you whether people are dropping off, but it doesn’t tell you why they do it. Brainstorm the potential issues. Is the registration process too long and hard to fill, do you have clear messages and good product descriptions, are there too many steps and blanks to fill in before ordering a product, etc.
Quality over quantity – it is vital to not just attract visitors but also to make them stay. If you want to increase the quantity, then observe from where your audience is coming – social media, Google ads, Internet search, etc. Increasing the number of visitors doesn’t guarantee higher conversion. But, proper maintenance of the funnel will help get the most out of your new users.
Fine-tune your filtering! Some customers might be looking for a particular product while others are just browsing. Filter out those who are not your target.
Conversion windows. If you are selling shoes, from first opening a product page to placing an order, it might take a couple of minutes, but if you are comparing streaming services, it will take a little longer to complete the task. Keep that in mind.
Funnel Analysis Benefits
Allows you to determine key events on customers’ journey
Improve customer experience and satisfaction
Track any changes in your visitor habits
Helps you decide where you can increase budget and where you can scale back
Compare conversions between different dimensions like countries, genders, age buckets, app versions, and many other segments.
Example
A visitor is coming to your website, and he’s seeking products, then if the products are interesting enough, he will add them to the basket and then end up buying them. Let’s explore three stages of a user journey:
Awareness stage – a user is on your website or an app, and they have a problem. You get the attention of your future customer or user.
Review – the visitor is on the product/service page and scrolling up and down. He gets familiar with your product or service. Maybe he is comparing prices, using provided filters, and estimating how much he needs the product. Anyway, you’ll never know what’s in his head. As a result, he sees the solution for his problem in your website or app.
Finally, he makes a decision. The visitor wants your product or service and makes a purchase. Congratulations, your visitor is now a customer.
That’s the ideal route, but sometimes visitors can go back and forth on the steps. Let’s dig a little deeper. Here’s where the true funnel analysis happens: If visitors are dropping off between 1st and 2nd steps, you should check whether there is enough information about the product. Are you providing helpful information like a help menu or a chat box, or anything visitors can use as guidance? If a visitor is dropping between the 2nd and 3rd steps, you should focus on prices, check competitors, and make sure you have a unique product or service. By observing where your visitors are dropping off, you can define your weak points and discover places where improvements should be made.
There is one final step – coming back or re-engaging. After seeing a customer making a purchase, you will want to invite them on another journey of being your repeat client. You can offer a discount on their next purchase, and sign for your newsletter, and like your social media page to support your cause.
Pro Tip
High drop-off usually means UI problems. But before scratching everything and returning to the drawing board, examine the audience who are dropping. Are they teenagers or elderly? Are they your targeted audience? If not, it’s a better idea to remove them from your funnel analysis.
Conclusion
Funnel analysis is a useful process that will support you on your way to building an exceptional product. However, it’s not the final phase. If you want to know the middle steps that your user or a visitor takes, consider doing a Path analysis and examining where your users are getting confused. Path analysis is an integral part of conversion rate optimization. We’ll cover this in a future post.
Want to see how Kubit can help you understand your user’s behavior? Get in touch with an expert to learn more.
Web analytics is the analysis of how users interact with and behave on a website. Web analytics solutions track a variety of aspects of user activity and behavior on a website, including the number of visitors, the length of their visits, the number of pages they see, and other key performance indicators relevant to a website’s goals.
An organization’s key performance indicators (KPIs), such as the purchase conversion rate, click-through rate, and bounce rate, are measured and benchmarked using web analytics tools.
What Is The Significance Of Web Analytics?
In order to provide an optimized user experience, data must be collected on how those users interact with a website. That data can then be used for things like design iteration, Conversion Rate Optimization, and Marketing Campaign Optimization.
By using the insights provided by web analytics, organizations can properly promote the right products to the right people. The data-backed decision-making provided by web analytics takes the guesswork out of website optimization and allows for companies to maximize ROI.
How Are Web Analytics Used?
There are a variety of web analytics tools that allow for simple integration and provide meaningful insights on User Behavior. The complexity of these tools can vary greatly depending on the depth of insights desired on a particular website.
Many web analytics tools use click-counting tags to get a high-level overview of which pages users visit on a website. The tag may also collect other information, such as the kind of device, browser, and location of the user (via IP address).
Cookies may also be used by web analytics services to keep track of individual sessions and assess whether a particular browser is returning to a website repeatedly.
Although cookies have been a popular method of tracking web analytics, many users are now blocking cookies from their browsers through things like ad blockers and VPNs. This makes cookies an increasingly unreliable source of data.
Best Practices For Web Analytics To Improve Your Website
Finding meaningful insights through web analytics and reporting those findings to others in your organization can be a tricky process. Here are a few things to remember while working in this area:
1. You Should Not Simply Provide Traffic Updates
Reporting on traffic, page views, top sources, or top pages merely scratches the surface. If there is more traffic or time spent on the site, it doesn’t always imply that the site is successful. When it comes to measuring the performance of your program, having 7 million visitors is a non-essential metric.
2. Insights Should Always Be Provided Alongside The Data
It’s a waste of time and effort to provide analytics to your stakeholders without providing any context to your company or user objectives. Show how your site’s data points to areas of success and development by highlighting the data’s relevance to your site.
3. Avoid Focusing On A Single Point In Time While Reporting
There are more complicated and deeper web experiences occurring today than can be captured by looking solely at visits or a given time period. It is possible to assess how well your website is performing as it develops and interacts with visitors, particularly recurring ones, by looking at metrics such as visits, user-lifetime value, and other values that give a more long-term knowledge of people and their use
4. Be Unambiguous In Your Communication With Key Stakeholders
Make sure your stakeholders are aware of the system’s flaws and that the information you offer is accurate and up-to-date, and that you are aware of your audience.
To learn more about how Kubit can help with your analytics, click here!
Retention rate, also known as customer retention rate, is an important metric that measures how well a company keeps its existing customers. But what is it and how is it measured?
What Is Retention Rate?
Retention rate is a metric that measures the percentage of customers who return to use a product after they have already used that product. An example of this could include how many past customers return to make another purchase.
How to calculate retention rate
It’s calculated by dividing the number of customers who return to perform a critical event (i.e. Purchase, Play a Video, Log In) by the number of past customers. So if 50 out of 100 former customers return, your retention rate would be 50%. This can also be viewed in the inverse as a churn rate vs. retention rate. Users who did not return would be counted as churned.
There are a few ways you’re able to measure Retention Rates and it largely depends on the type of business you have. Let’s look at the 3 main Retention methods you should consider.
N-Day Retention
Counts users as returned on the Nth or specific day(s) they came back. Best used for retention that can be sporadic as this method counts the specific day a user returns to your app or website.
Example Use Cases for N-Day Retention
How often users return to download a new game
How often do new users return to check their status
What day are most users churning from premium features
Unbounded
This measures the percentage of users who have ever come back to your app on a day or any day later. Best when you have stretches of time between return events and don’t expect users to return every day/week/month.
Example Use Cases for Unbounded Retention
What is our New User Day 7 retention rate
How often does a user return to complete a new task
What is our Day 30 day retention rate
Rolling
Rolling retention is called Rolling, because we also want them to have a returning event on each date between the starting cohort date and Nth day. This means if your app is something designed to be used consecutive days/weeks/months you should leverage this method. It’s also great to identify cohorts of users who are highly engaged or exhibit “binge” behavior.
Example Use Cases for Rolling Retention
What % of Users return on each day of their 7 day trial
Who binges 5 days in a row
Who is our Power User group that logs in 3 days in a row
Your retention rate can tell you whether or not customers are happy with your service or product, whether they feel satisfied with the value they receive, and if they have any gripes or issues that need to be addressed. You can use this data to make changes in your business practices and tailor the method to your business model.
Why Should You Care About Your Retention Metrics?
Active customers are more likely to purchase more products and refer friends to your company. They’re also more likely to stick around longer than people who aren’t engaged with your brand.
This form of user behavior data can help you understand why customers might stop using your product by looking at their behavior patterns after they leave.
For example, suppose 80% of users exit the app within 30 seconds.
They give your insight into your customers’ behaviors.
They help you understand what they like about your product or service.
They reveal which features are most important to them.
They can help you predict churn rates and plan for it before it happens.
How to Improve Your Retention Rate
Customer retention strategies are the key to a successful business.
Don’t let your customers slip away! Here are five ways you can keep them coming back for more:
Be Responsive
If a customer has a problem or question about one of your products or services, don’t make them wait on hold for hours or go through multiple phone calls before answering their question.
Offer Great Customer Service
A good reputation is everything in business. If your customers have a negative experience with your business, they will tell their friends and family, who will say to their friends and family, etc. If they have a positive experience, they will tell that to others.
Communicate Regularly
Customers like knowing what’s going on with their order status and when it will arrive at their doorstep (or doorstep). It also reduces confusion if there is an issue with their order or delivery schedule (which happens more often than not). You can communicate with customers via email newsletters or social media platforms like Facebook.
Understand your Customer’s Behavior
Getting to know how your customer interacts with your product is a key aspect to keeping them engaged. Using Product Analytics tools like Kubit can provide your team with valuable insights that will help refine your product experience and provide an optimized experience for your customers.
How Retention Rates Can Be Used
Retention Rates in Streaming Media
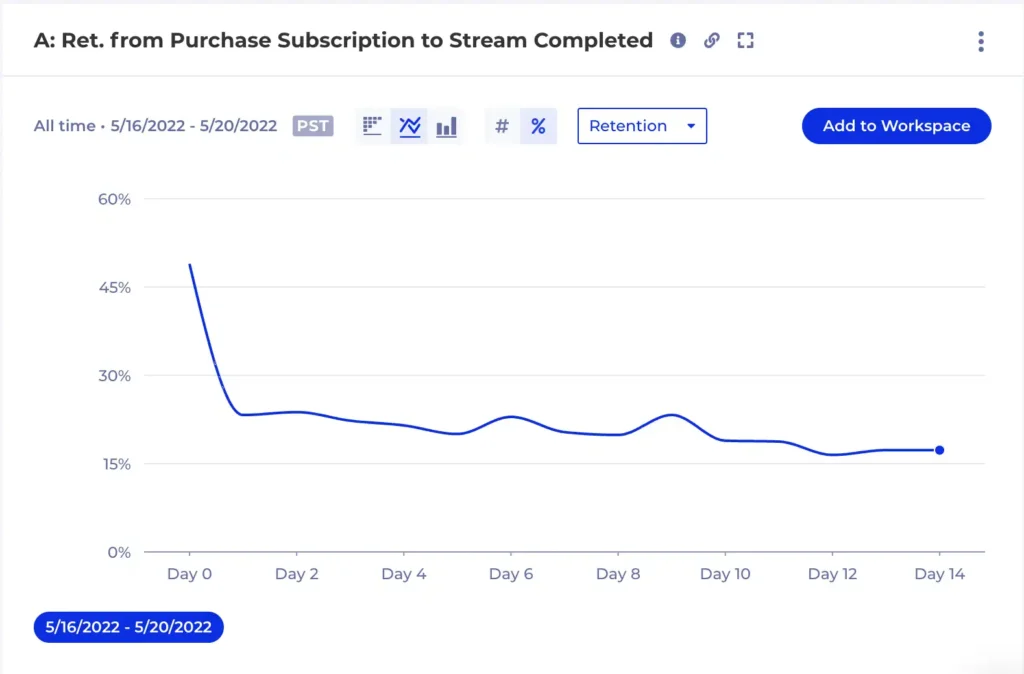
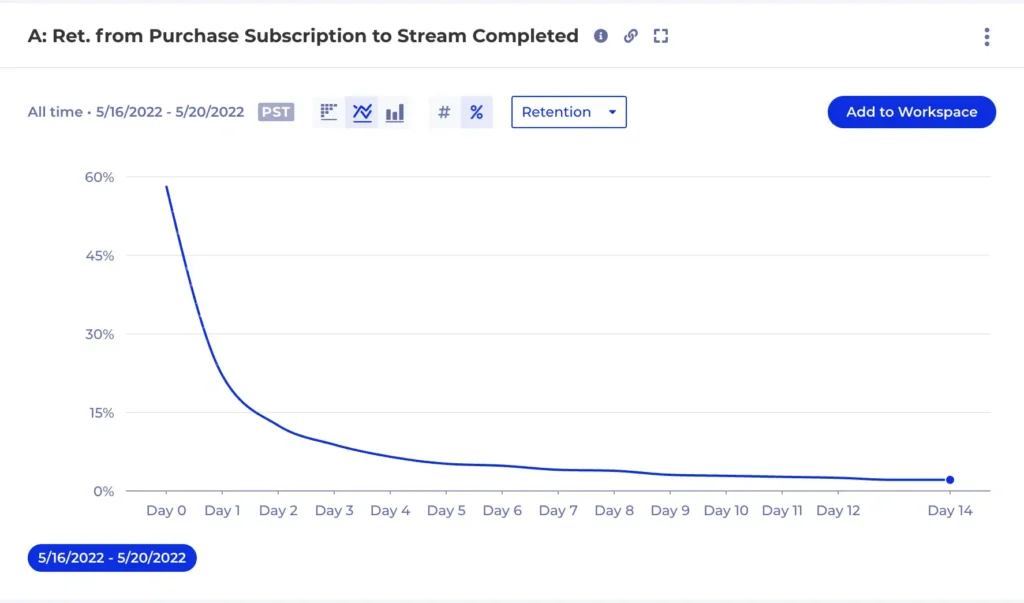
A Kubit customer needed to understand binge watcher behavior which they defined as a user who watches more than 100 minutes of content each day of a 7 day period. In Kubit they were able to build a Rolling Retention chart with the starting and returning event as “Watching at least 100 minutes of content” to understand:
How many of these users did they see in a 90 day period?
Does the binge behavior change based on the type of content they watched?
What did they learn? Well they saw that this behavior was very concentrated on content types, specifically Classic TV audiences. They also saw that users who watch Classic TV in a binge cohort don’t watch much else and any effort made to market different content weren’t fruitful. This allowed them to lower the investment in that hypothesis and focus more on other segments of their population.
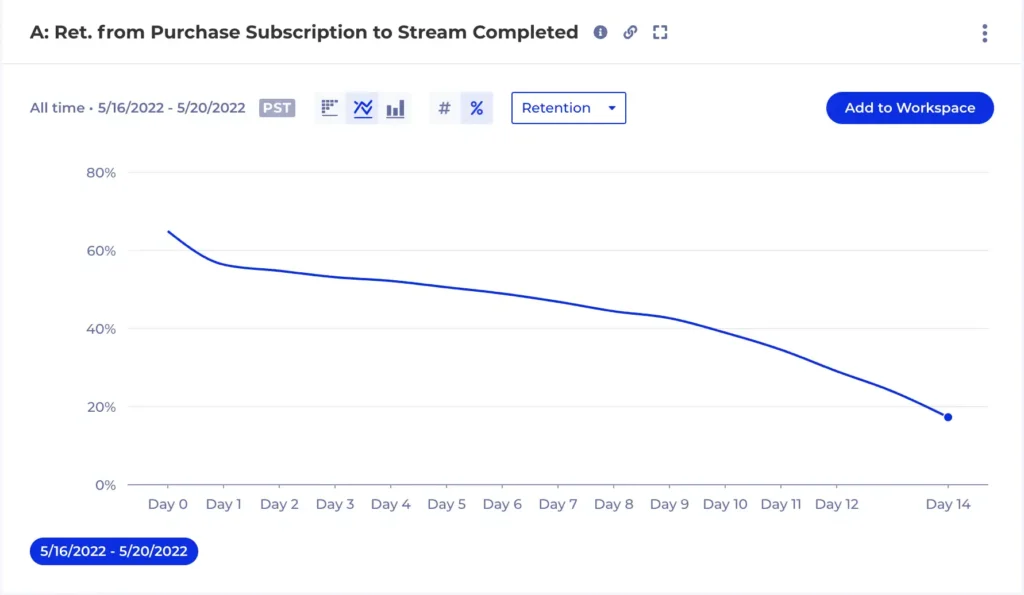
Retention Rates in Travel
This customer needed to see what characteristics of the Companies that sign up for their corporate travel service lead to higher retention rates.
Because travel happens sporadically they were able to build a Retention chart based on Unbounded Monthly retention to best capture the natural rhythm of the booking behaviors. They saw a prominent linear Retention increase depending on the size of the Company. This meant that attracting and onboarding Companies with large user bases is a critical acquisition strategy as well as making the process of adding more travelers to the service.
Bottom Line
To summarize, the definition of retention rate is the sustained or repeated use of a product. To reach an effective and long-lasting business, you need to retain your users perfectly.
Retention can be utilized to improve user loyalty to your product. In addition, it can be considered a tool for driving sales and revenue in your company.
Click here to learn more about Kubit and how it can help optimize your retention rate.
Understanding the importance of Monthly Active Users (MAU)
What is Monthly Active Users (MAU)?
Monthly Active Users (MAU) is an engagement metric referring to the number of unique users that have interacted with a product or service within a given month. As a key performance indicator (KPI), MAU is an important aspect of measuring the health of many businesses.
The definition of terms like “users” and “active” might vary from business to business, since there is no industry standard. But, below are some general guidelines of how they are determined.
Users: when a business is determining MAU, a user is an individual who has performed some sort of in-app or on-site action during a 30-day period. This action could include logging in, completing a specific conversion, or executing a certain number of interactions. This individual will only be counted once regardless of how many interactions they have.
Action: Any business can determine how they want to define an action. But, in many cases, an action included in MAU can be opening an app, logging in, or performing a set number of interactions with a product or service.
Examples of How to Calculate MAUs
Oftentimes MAU becomes a more general count of “How many users do I see in my product each month?” but that can be less meaningful especially if there are events that don’t necessarily correlate to value. It’s important to define your MAUs not just based on their login or viewing a page but more tied to the value your product provides them. General examples include definition like:
Users Who Complete a Task
Users Who View/Interact with Core Feature
Retail/E-commerce MAU
In a Retail business MAU definitions are often:
Users who viewed a product
Users who logged in 2x
Users who purchased an item
These definitions are good ways to assess the value of the visit and ensure the users within your product are close or getting close to making a 1st, 2nd and 10th purchase. Users who visit your site and immediately leave or only view 1 page should not have the same weight as users who meet your MAU definition. Better segmenting a true MAU vs. the general traffic also helps you measure things like % of Total Users who were MAUs and assess if the user base you attract is graduating to the MAU segment.
Streaming MAU
Video streaming has it a bit easier when determining MAUs as the number of things you’re asked to do within the product is singularly focused on watching content most often.
In Streaming Media we see MAUs defined as:
Users who Watched at least X seconds/minutes/hours of content
Users who Watched at least X episodes of content
Segmenting users based on how often they are consuming content becomes a core part of how you measure MAUs when you’ve adopted this type of approach. Additionally you’re able to understand the share of all users who meet this criteria and you’re able to more accurately monitor growth of MAUs vs. all users.
Why is MAU important?
For most businesses, it is important to know how users interact with their product or service. A high MAU can generally indicate a good rate of product engagement and positive retention over a certain period of time.
By measuring MAU, a business can also determine the effectiveness of its marketing strategies, product iterations, and customer experience. MAU can also be used to determine other engagement-related KIPs including:
Retention
Churn
Growth rate
Conversion rate
Revenue per active use
On top of the many internal uses for MAU, it can also be used by outside sources to determine the overall health of a company. Public organizations like Facebook and Twitter regularly publish their MAU numbers in order for investors to view the performance of their user base.
When Should You Use MAUs?
Counting the number of users visiting your product and/or website is a valuable way to monitor overall health and growth, but is an MAU metric always necessary? It really depends on the product you’ve built and does an interval of Monthly actually align with how you intend your users to leverage it. Let’s see a few examples of when you should and shouldn’t use an MAU metric.
When Should You Use MAUs?
When your product is something that is intended to be used frequently, either at a daily or monthly interval.
When your product is a utility and part of major workflows for multiple users within your customers.
When your product’s pricing model is based on a Monthly or Annual billing schedule.
When Shouldn’t You Use MAUs?
If your product is seasonal or specific to a point in time and doesn’t require frequent usage.
Good examples of these would be Tax Software, Mortgage Software or Seasonal Sports/Events.
If your product isn’t something that multiple end users will leverage and is highly specialized software.
If your product’s pricing model is more consumption based and less reliant on calendar dates.
Why Kubit Uses MAU
Kubit uses MAU as the key metric to determine pricing for our customers. Using MAU as a basis for pricing gives Kubit’s customers cost predictability and freedom to use all of the collected data transparently. Other vendors in the Product Analytics space would typically charge per data volume which leads to unpredictable costs and sometimes would force users to start sampling their data. Kubit looks to avoid these issues by providing an easy, scalable, MAU-based solution to pricing.
To learn more about Kubit’s services and how we calculate our pricing, click here.
This website uses cookies to ensure you get the best experience on our website. Learn More