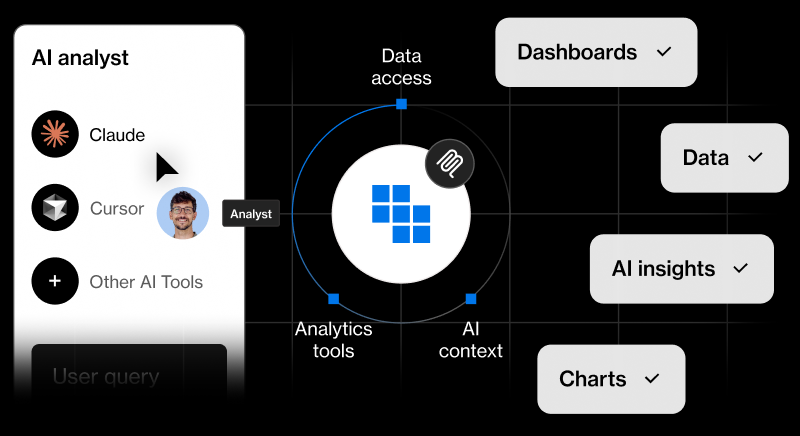
Go beyond dashboards. Kubit’s agentic analysts work natively with your data warehouse, investigate anomalies, explain why metrics change, and recommend actions to grow engagement, retention, and revenue.
Built for faster answers,
clearer stories, and smarter actions
Faster Answers
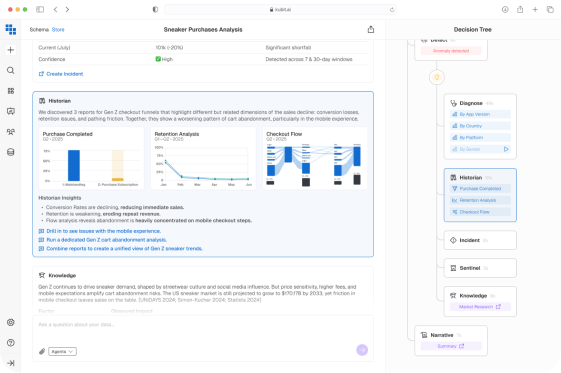
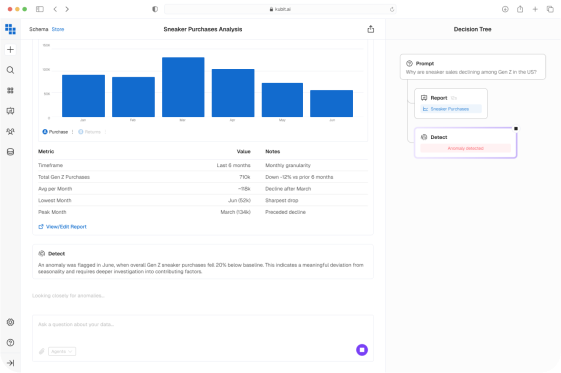
Investigations in hours, not weeks. Kubit’s agents proactively detect anomalies and trends, run full investigations, and show their work through transparent decision trees, so your team moves from question to action faster.
Autonomous Insights and Actions
Dashboards show what happened. Kubit explains why it happened and what to do next. Agents create evidence-backed storylines and even drive automated actions, like building cohorts to trigger Braze campaigns or notifying Slack.
Autonomous Insights and Actions
Dashboards show what happened. Kubit explains why it happened and what to do next. Agents create evidence-backed storylines and even drive automated actions, like building cohorts to trigger Braze campaigns or notifying Slack.
Complete Control
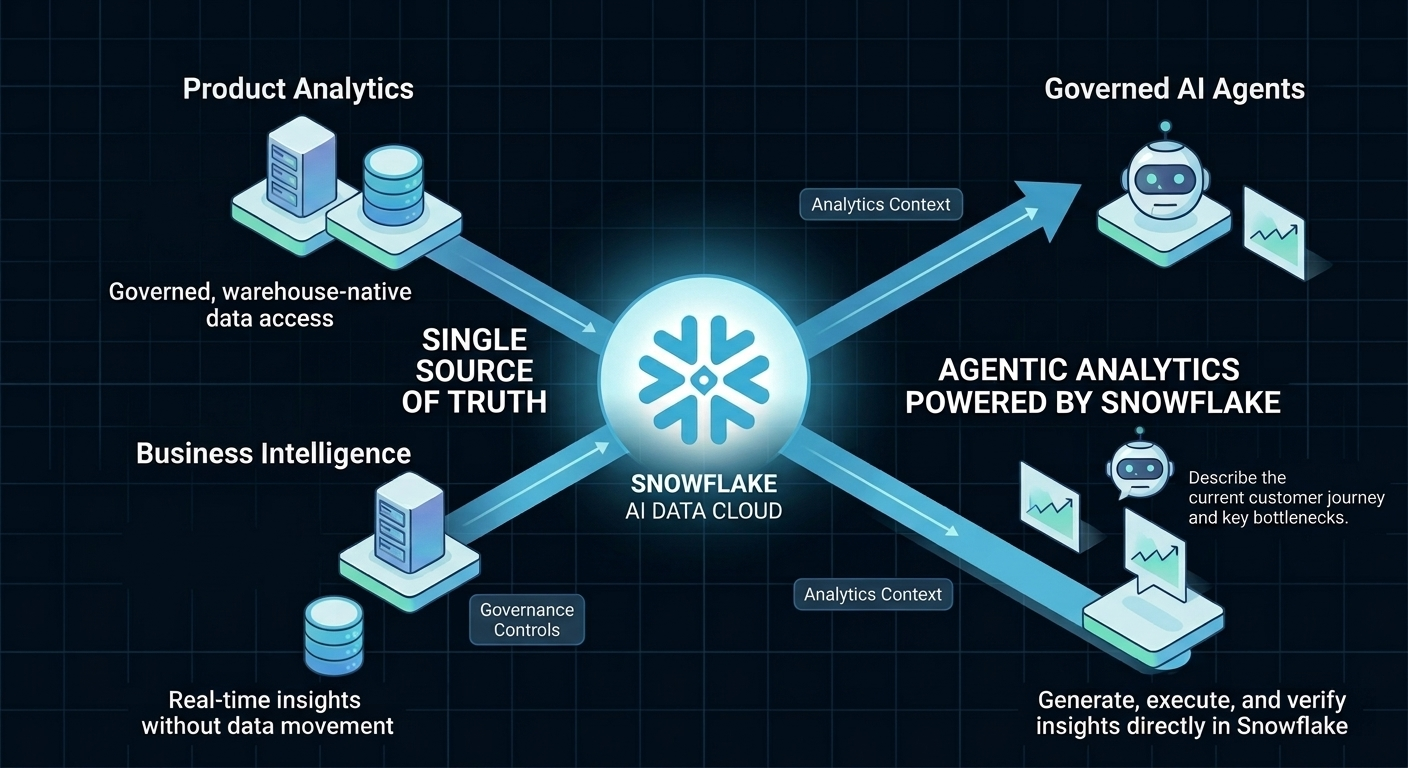
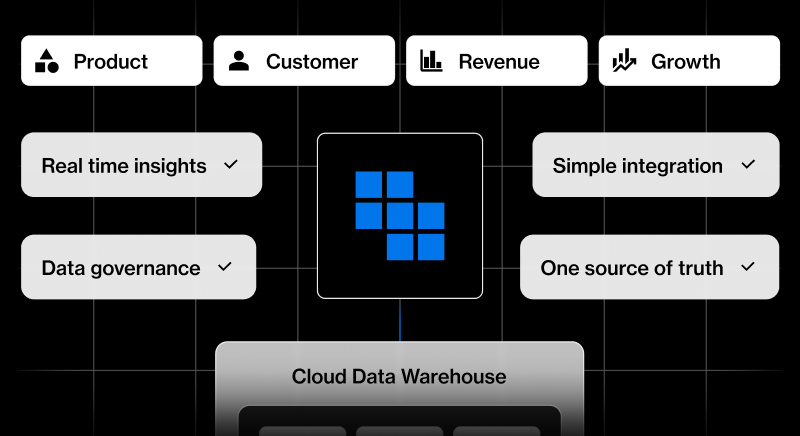
No silos. No black boxes. Kubit operates natively with your warehouse, ensuring every answer comes from governed, up-to-date data with a single source of truth.
Governed Autonomy
Explainable AI, taught and guided by human experts. Every answer shows its reasoning, so your team can trust the evidence and confidently act on it.
Core Capabilities
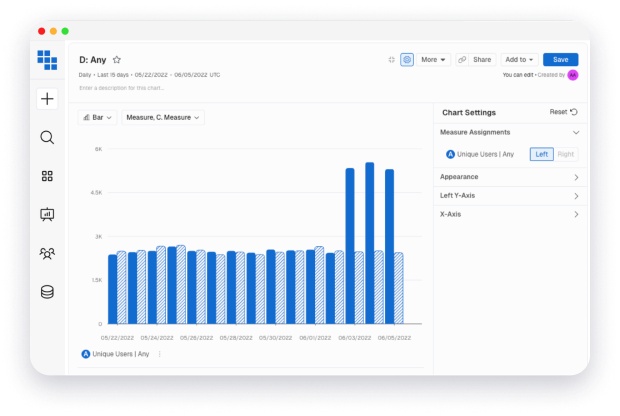
Time-series analysis
Visualize performance over time and drill into key segments. Compare line, stacked bar, or pie views for faster interpretation.
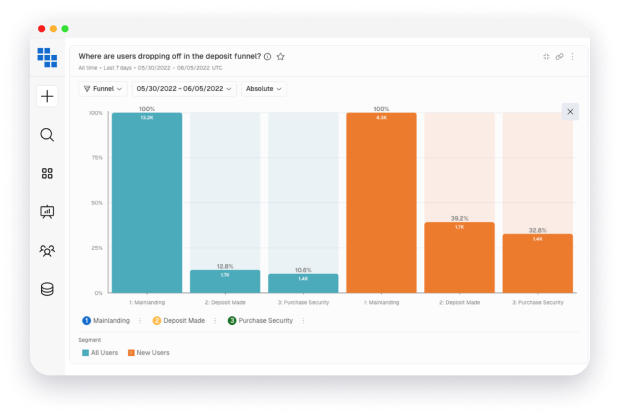
Funnel conversions
See how users progress (or drop off) through product flows. Segment by behavior, channel, or device to identify where friction blocks growth.
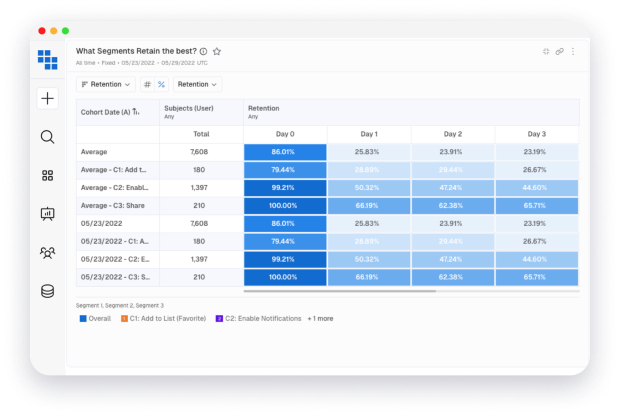
User retention
Model retention curves, usage intervals, and churn risks. Spot what drives loyalty and what signals disengagement.
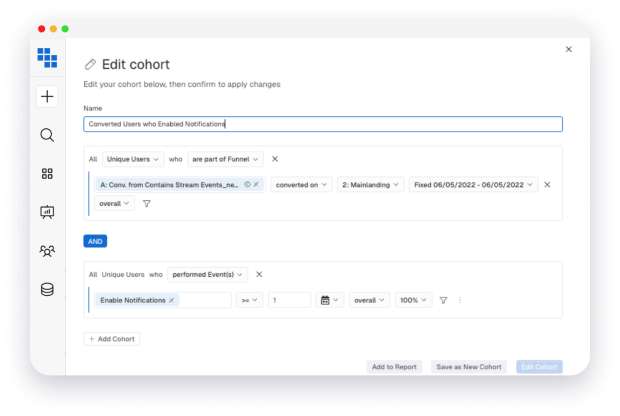
Behavioral cohorts
Define and reuse cohorts on the fly. Compare groups, measure impact, and sync them into external tools for targeting or personalization.