
Trying to run all of your analytics in Tableau is like towing a boat with a bicycle.
I love the bike – it’s perfect for certain jobs. It’s nimble, easy to handle, and perfect for quick trips. But I would never dream of hooking it up to a trailer full of gear and trying to haul it across town.
It’s the same with analytics. Tableau is great for data visualization. It shines at illustrating and sharing data, and with making insights feel approachable. But when you ask it to stitch together every behavioral event, performance metric, and customer journey touchpoint, things start to wobble.
This isn’t a knock on Tableau. It’s an acknowledgment that different jobs require different tools. And in analytics today, the “boat” we’re trying to pull is a lot bigger than it used to be.
According to Gartner, the BI and analytics market reached $17.6 billion in 2023, and competition is no longer just about pretty dashboards. It’s about speed, scalability, and self-service analytics that work with raw, complex data. Yet users repeatedly mention that BI tools can struggle with performance when datasets get large, leaving teams searching for Tableau alternatives that can share the load.
“Power BI is great for visualizing pre-aggregated data, but it typically requires heavy upfront modeling work. Maintaining and iterating on cohort definitions can become a bottleneck, especially as questions evolve.” – BI user on Reddit | in r/PowerBI Forum
From BI Dashboards to True Customer Journey Insights
When I was at Tableau, I got to see what happens when people finally get direct access to their data. It was transformational.
Before, most analytics lived behind what we jokingly called the “report factory.” If you wanted a number, you put in a request and waited. Sometimes days, sometimes weeks. By the time you got your dashboard, the question that sparked it had already changed.
Tableau broke that cycle. Suddenly, marketing managers, product leads, and finance teams could explore their own BI dashboards, find answers on the fly, and use data in conversations without a translator. Decisions sped up. Data trust skyrocketed. The whole culture around analytics shifted.
Now, we’re hitting that same kind of inflection point with Customer Journey Analytics. Only this time, the challenge isn’t access: It’s consistency and clarity.
![]()
Most organizations today juggle:
- Disconnected BI reporting tools and data silos that don’t talk to each other
- Duplicate reports and mismatched definitions of the same metric
- Dashboards that require a meeting just to interpret
It’s no surprise that Forrester found 62% of data and analytics leaders cite inconsistent metrics as their top obstacle to delivering value. It’s BI déjà vu—we’re living through the same growing pains, just in a new arena.
Kubit + Tableau: A Better Together Approach
The answer isn’t to throw away Tableau or Power BI: It’s to pair it with the right partner.
That’s why I joined Kubit. We work alongside Tableau, not against it. Kubit connects directly to your warehouse with full SQL visibility, so every metric is transparent and traceable. Product and data teams are getting a week’s worth of analytics in minutes with Kubit – trading reporting bottlenecks with instant insights.
You get the visual storytelling Tableau is famous for, plus the deep, complex analysis your customer journey demands.
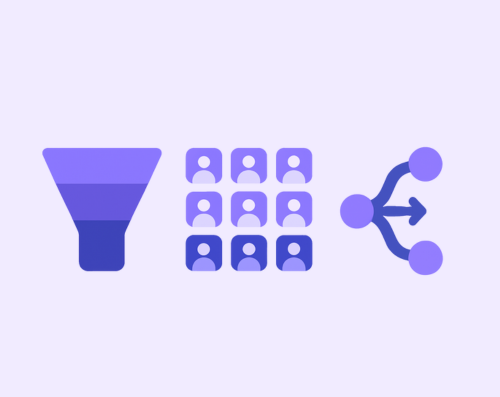
With Kubit, you can generate granular, self-service insights via:
- Cohort Analysis – See how retention changes for customers acquired in different months or through different campaigns.
- Path Analysis – Understand the exact steps users take before buying, upgrading, or leaving.
- Funnel Analysis – Identify where the biggest drop-offs happen in your sign-up, onboarding, or checkout flows.
Why does this matter? McKinsey reports that companies using customer journey analytics see up to a 15–20% boost in customer satisfaction and a 10–15% revenue lift. That’s the kind of change you feel across the business.
Download the Guide: Bridging BI with Customer Journey Analytics
Traditional BI tools help you understand what happened, but not why it happened. Our comprehensive guide explores how pairing BI with Customer Journey Analytics gives your teams the full story, combining big-picture metrics with granular, self-service insights into user behavior.

Why Transparency Matters Now
We call it Transparent Customer Journey Analytics because there’s no mystery about where your data comes from or how it’s calculated.
Everyone – from analysts to product managers – works off the same trusted source of truth. There’s no duplication of data, no hidden proprietary logic, and no “take our word for it” dashboards. If you want to see the SQL behind a report, you can. If you want to check the raw numbers, they’re right there.

This matters because when people trust the data, they use it. When they don’t, it just sits there. And trust is hard to build if you can’t see under the hood.
When Tableau came along, it took BI out of the back office and into the hands of the people who needed it. Kubit is doing the same for customer journey analytics—removing friction, speeding up insights, and giving everyone the confidence to act.
Looking Ahead: Avoiding the AI Hype Trap
AI is the newest wave to hit analytics, and I’m already seeing the same pattern I saw with BI: legacy vendors scrambling to catch up.
Too often, the “AI features” they pitch are really just custom-built demos—impressive on stage, but expensive, brittle, and impossible to scale. You think you’re buying a product, but you end up buying a services engagement in disguise.
We took a different path. Kubit’s Lumos AI is baked into the core platform. It’s designed to work across all use cases and all users. With “Ask Kubit,” anyone can query the data in plain language and get insights instantly – no waiting on the data team, no special setup.
It works with your existing data model, so the answers are consistent with every other metric in the system. That means faster access to insights without introducing another layer of complexity that someone has to maintain.
The Bottom Line
If your BI tool is starting to feel like the wrong vehicle for the job, it’s worth exploring complementary solutions that can share the load.
Kubit brings the transparency, scalability, and flexibility that modern BI dashboards and BI reporting tools can’t always deliver alone. Pair it with Tableau, and you get the best of both worlds: stunning visual storytelling and deep, trustworthy customer journey insights.
Stop towing a boat with a bicycle. Give your analytics the horsepower it needs.