
What are product analytics metrics and why are they important
In the digital age, data is the lifeblood of any business. It can transform a company’s trajectory, inform strategic decisions, and predict customer behavior. But data alone isn’t enough. It’s the application of relevant metrics that can truly drive business growth. When created and measured appropriately, metrics can help illuminate the path to better customer experiences, optimized products, and business success. However, not all metrics are created equal. The key lies in selecting ones that are meaningful, actionable, and tied to your specific business objectives.
In this blog post, we dive into the importance of metrics in product analytics, how to set the right ones, and when to measure and evolve them.
Understanding Quality Metrics
Quality metrics provide actionable insights that are specific to your business. They’re quantifiable, easy to understand, and directly linked to your key performance indicators (KPIs).
For instance, an essential metric is Viewing Time in seconds if you’re a streaming media business like ViX. That heartbeat metric is directly tied to the business goals of driving more watch time and directly impacts revenue. Please check out this case study for a more detailed overview of how ViX teams use Kubit to support and enhance their daily work.
Setting Quality Metrics
Identifying the right metrics is vital for your product’s success. Here are some common categories of metrics to consider:
Acquisition
Acquisition metrics are crucial in understanding how effectively you’re attracting new users. By capturing and utilizing these metrics, you gain valuable insights that fuel informed decisions about your product’s growth strategy.
Acquisition metrics track the process of bringing new users into your ecosystem. This includes aspects like website visits, app downloads, sign-ups, and user acquisition cost (UAC) across different marketing channels. Analyzing these metrics helps you identify which channels are most successful in attracting your target audience. Imagine you see a surge in sign-ups from social media ads compared to email marketing. This tells you to invest more resources in social media campaigns.
Furthermore, acquisition metrics help you optimize your marketing spend. You can identify areas where you get the most bang for your buck by tracking UAC per channel. This allows you to allocate your budget more efficiently towards channels that deliver high-quality users.
Overall, capturing and utilizing acquisition metrics is essential for any product team aiming to grow its user base. They provide a data-driven perspective on your marketing efforts, ultimately leading to a more targeted and successful product strategy.
Activation
Once you’ve acquired a new user, you must focus on how best to activate them and turn them into engaged users. Capturing and utilizing activation data is critical for optimizing your product and maximizing its long-term value.
Activation metrics focus on that critical “aha!” moment when users discover the core value proposition of your product. This might involve completing a specific action, like purchasing in an e-commerce app or creating a first post on a social media platform. Tracking activation rates (percentage of users who reach this point) and time to activation reveals valuable insights.
For example, a low activation rate could indicate a confusing onboarding process or a lack of a clear value proposition. By analyzing user behavior leading up to activation, you can identify friction points and streamline the user journey. Additionally, a long time to activate might suggest the need for in-app tutorials or targeted prompts to nudge users toward the core functionality.
Ultimately, utilizing activation metrics allows you to personalize the user experience and remove roadblocks that hinder engagement. By focusing on activation, you ensure those who acquire your product become invested users, driving long-term success.
Engagement
Engagement metrics are the lifeblood of understanding how users interact with your product. This data is paramount for fostering a sticky and successful product and goes beyond simply acquiring users; they delve into how deeply users interact and derive value from your product.
Examples include daily/monthly active users, session duration, feature usage frequency, and content consumption. By analyzing trends in these metrics, you can identify areas that spark user interest and those that lead to drop-off.
For instance, a consistent decline in daily active users might indicate waning interest. If you investigate further, you might discover a new competitor offering a similar feature or a recent update that introduced bugs or a confusing interface. Conversely, a surge in a specific feature’s usage could signal a hit with users. This valuable insight allows you to double down on success and prioritize improvements in areas causing disengagement.
Ultimately, utilizing engagement metrics empowers you to refine your product roadmap. You can prioritize features that drive deep user engagement, fostering a loyal user base that consistently returns. This translates to increased product adoption and opens doors for monetization and long-term product viability. By focusing on engagement, you ensure your product isn’t just acquired but actively used and loved by your target audience.
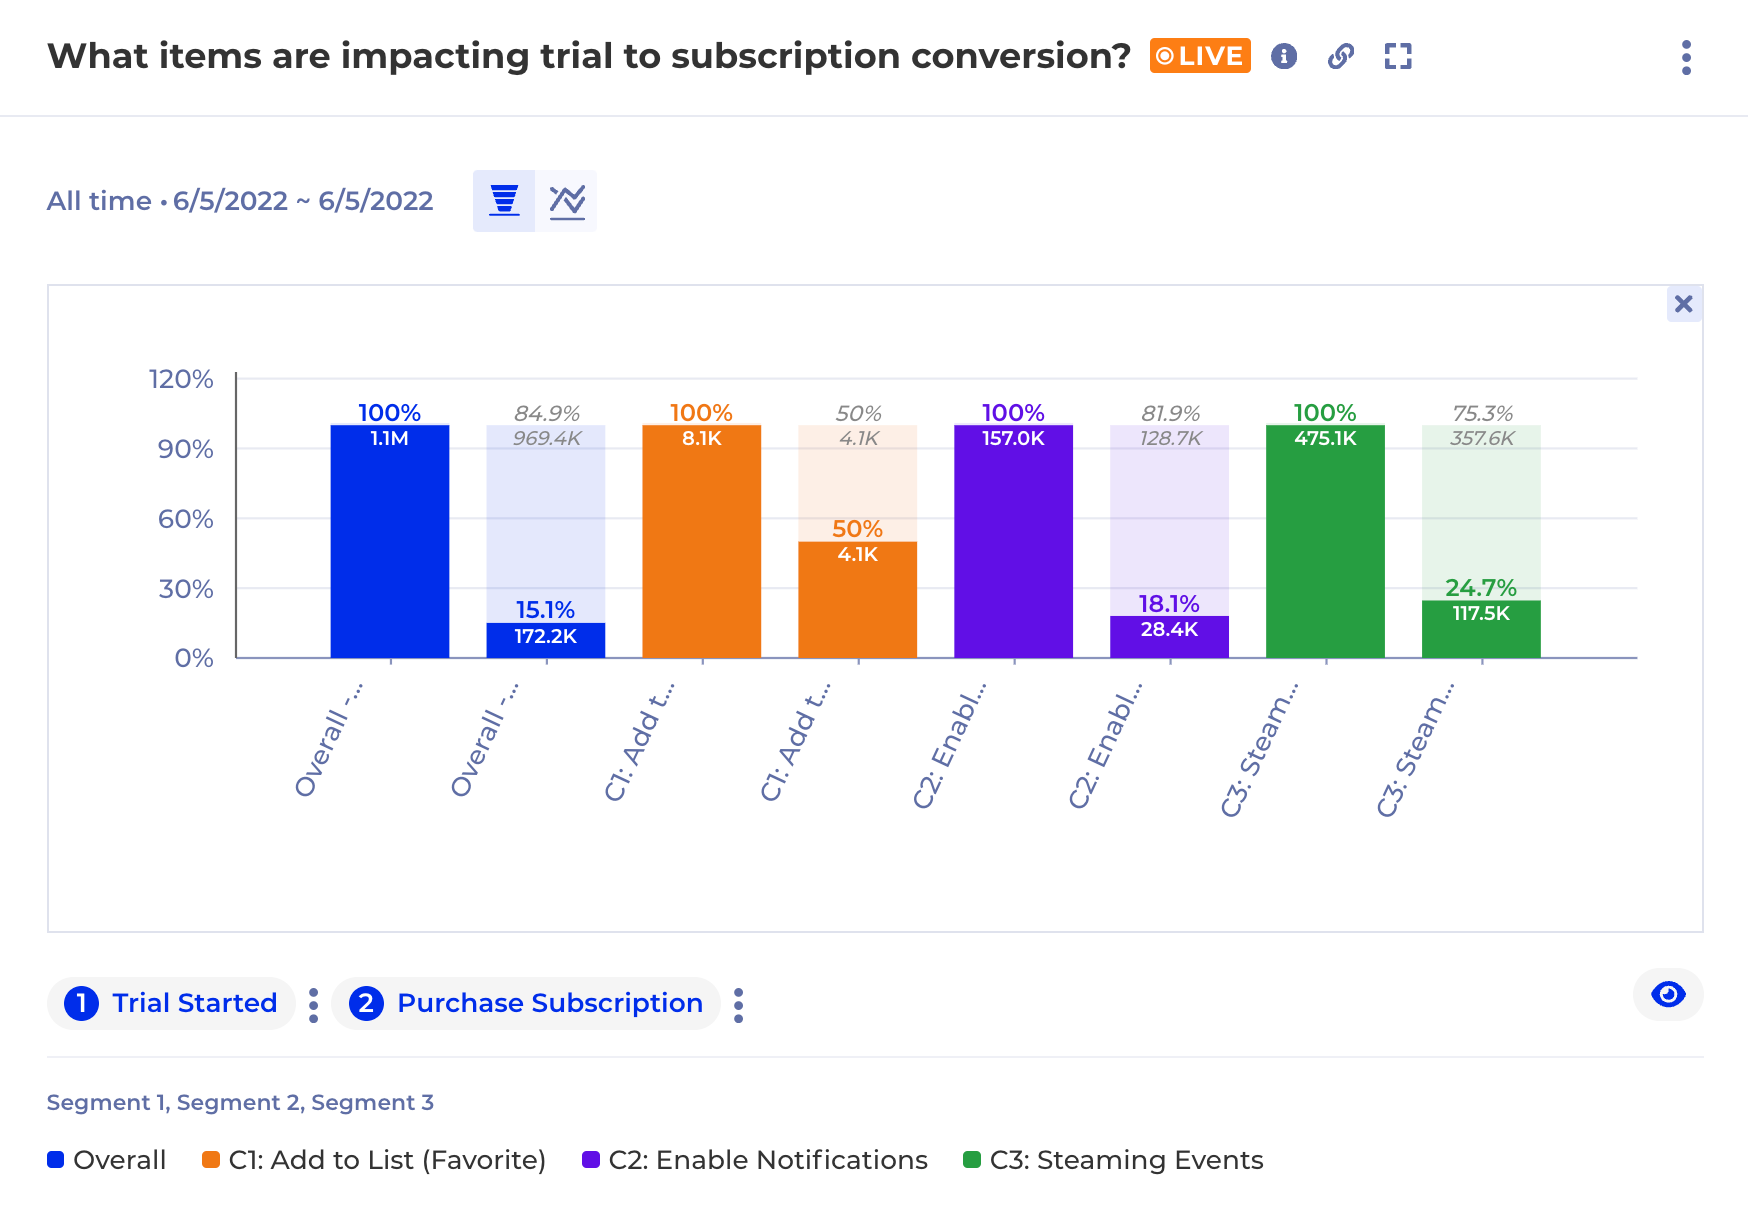
Conversion
In the realm of product analytics, conversion metrics are the champions of measuring success. Capturing and utilizing this data allows you to understand how effectively you’re guiding users towards achieving your desired goals within the product. These goals can vary depending on your product type – a purchase on an e-commerce platform, completing a level in a game, or subscribing to a premium service.
Conversion metrics track the user journey towards specific actions. Common examples include click-through rates on calls to action (CTAs), add-to-cart rates, sign-up completion rates, and conversion funnel analysis. By analyzing these metrics, you gain valuable insights into how well your product is facilitating the desired user behavior.
Imagine a low conversion rate for your premium service sign-up. This could indicate a confusing pricing structure, an unclear value proposition, or a poorly designed sign-up process. Utilizing conversion metrics lets you identify these bottlenecks and optimize the user journey. A/B testing different CTAs or simplifying the sign-up flow can significantly improve conversion rates.
Ultimately, capturing and utilizing conversion metrics empowers you to maximize the value users derive from your product. By optimizing conversion funnels, you ensure users complete desired actions, leading to increased revenue, higher user satisfaction with achieving their goals, and, ultimately, a successful business.
Impact
In the fast-paced world of product development, every decision counts. Capturing and utilizing feature impact metrics is a critical tool in helping you understand how individual features influence user behavior and overall product success.
These metrics go beyond simple feature usage. They delve deeper, measuring the impact a specific feature has on key performance indicators (KPIs) like engagement, conversion rates, or even user satisfaction. This allows you to identify features that are driving positive outcomes and those that might be hindering progress.
For example, imagine you introduce a new social sharing feature in your productivity app. While user adoption might be high (many users try it out), the feature impact metric could reveal a negligible improvement in overall user engagement. This valuable insight suggests the feature might not be addressing a core user need.
By capturing and utilizing feature impact metrics, you gain a clear picture of how each aspect of your product contributes to the bigger picture. This data empowers you to make data-driven decisions, prioritize features that deliver real value, and ultimately build a product that resonates deeply with your users.
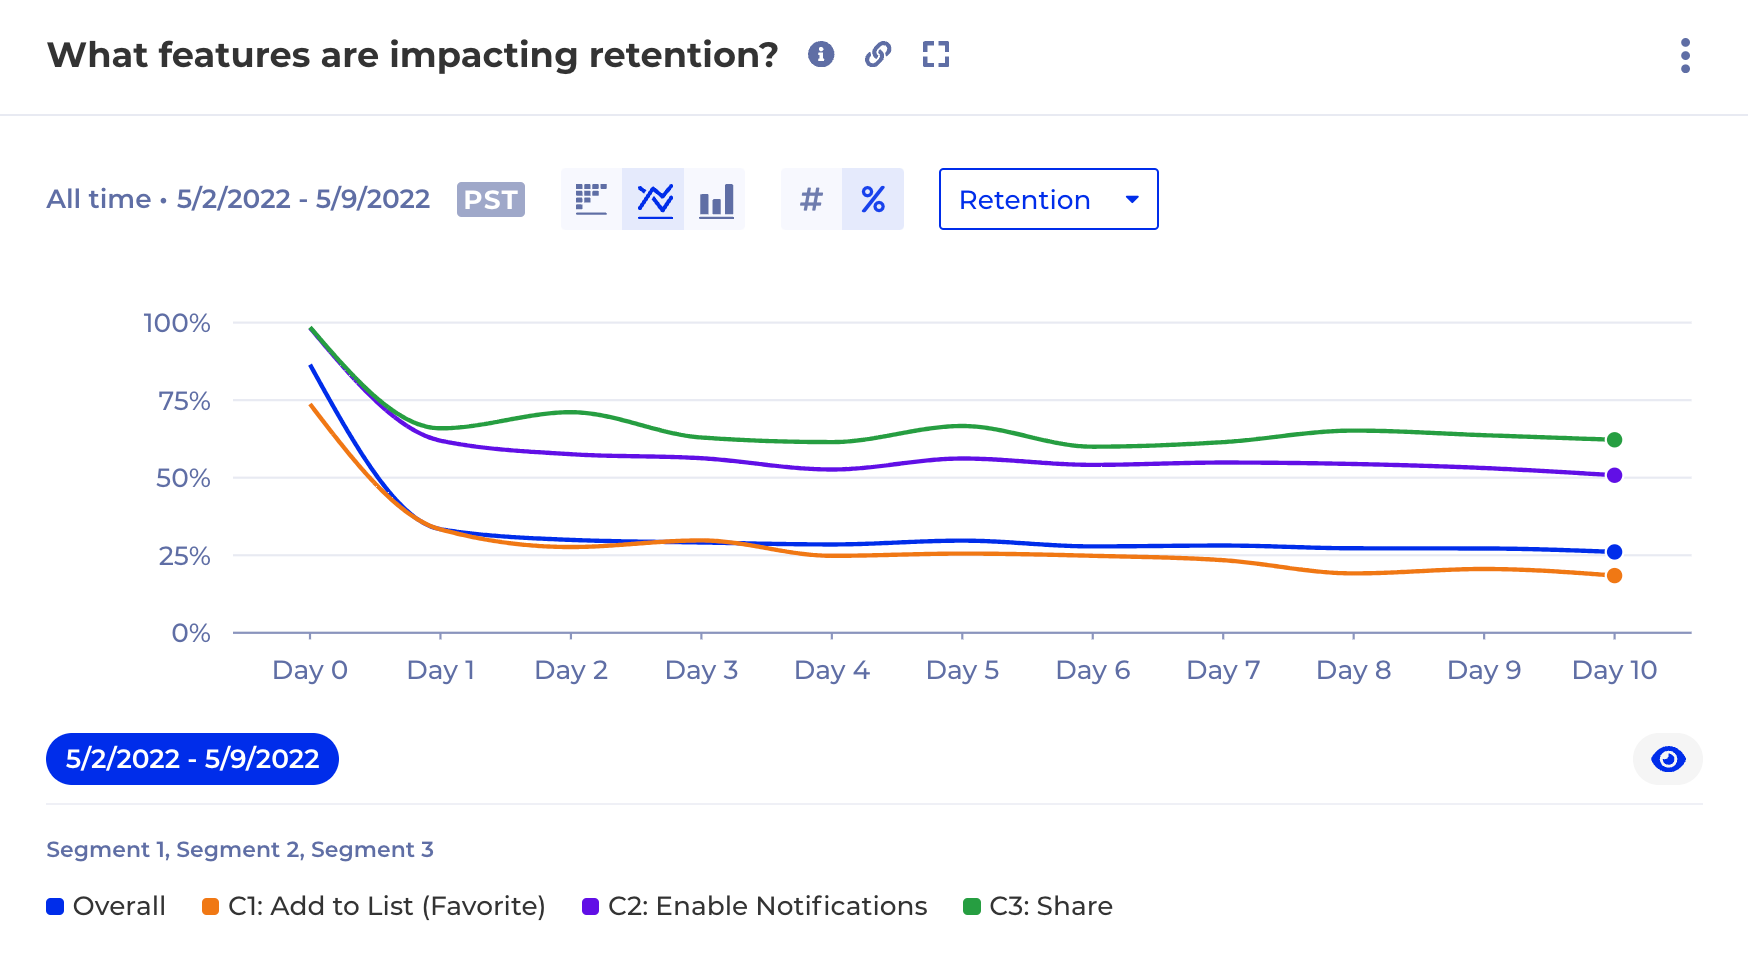
Retention
After going through the hard work of acquiring and activating new users, retention is the key to measuring long-term success. Capturing and utilizing retention data is paramount for building a product with lasting value and a loyal user base.
Common retention metrics include daily/monthly active users (DAU/MAU), and user lifetime value (LTV). By analyzing trends in these metrics, you gain valuable insights into user satisfaction and the “stickiness” of your product.
Imagine a steady decline in DAU or a high churn rate. This could indicate features that lose their appeal over time, a confusing user interface, or a lack of ongoing value proposition. Utilizing retention metrics allows you to identify these pain points and take action. This might involve introducing new features that drive continued engagement, simplifying the user experience, or implementing onboarding programs that foster deeper user understanding.
Ultimately, capturing and utilizing retention metrics empowers you to build a product that users love. By optimizing for user retention, you foster a loyal user base that consistently returns, leading to increased revenue, and improved brand reputation.. Retention metrics are the compass that guides you toward building a product with lasting appeal and a sustainable future.
Churn
Having an early warning system in the form of churn metrics is critical in mitigating potential issues. By effectively capturing and utilizing churn data, you gain invaluable insights into why users abandon your product, allowing you to identify and address issues before they become widespread.
Churn metrics track the rate at which users stop using your product over a specific period. This seemingly simple metric reveals a wealth of information. Analyzing churn rates across different user segments, timeframes, and acquisition channels allows you to pinpoint areas where users are most likely to churn.
Imagine a high churn rate amongst users who signed up through a specific marketing campaign. This could indicate misleading advertising that didn’t accurately represent the product’s value proposition. Conversely, a surge in churn shortly after a major update might point to usability issues or a confusing new interface.
By capturing and utilizing churn metrics, you gain a proactive approach to user retention. This data empowers you to identify and address issues that lead users to churn, ultimately fostering a loyal user base and building a product with lasting appeal.
Choosing the right metrics depends on your business type, product, and specific goals. There’s no one-size-fits-all approach, but keeping these categories in mind will guide you toward meaningful metrics that reflect your product’s performance and user behavior.
Measuring and Evolving Metrics
Once you’ve identified the right metrics, the next step is to measure them regularly to understand the baselines and make informed decisions. The frequency of measurement depends on the specific metric and your business needs.
For instance, DAUs (Daily Active Users) might be measured daily, while churn rate or retention might be measured monthly or quarterly. Reviewing and updating your metrics periodically ensures they remain relevant as your product and market evolve.
Also, remember that metrics should be seen as tools for learning and improvement, not just reporting. If a metric is consistently underperforming, use it as an opportunity to investigate, learn, and iterate on your product.
Metrics with Kubit
Kubit stands out in the crowded data analytics space due to its unique ability to seamlessly handle a comprehensive spectrum of data types, including but not limited to online, offline, transactional, operational, and behavioral data. Our warehouse-native approach ensures that organizations have the ability to access, analyze, and assimilate ALL of their data with Zero-ETL. This sets a new standard for creating, measuring, and adjusting metrics, offering unparalleled flexibility and precision. Unlike other solutions that mandate predefined data models in their data silos or limit the scope you can view, Kubit’s platform empowers you to explore every facet of your data and gain deep, actionable insights. This differentiation unlocks improved data-driven decision-making and gives you a competitive edge in today’s data-centric business environment.
Conclusion
Meaningful metrics are the guiding compass in navigating the expansive realm of product analytics. They provide a clear direction, enable informed decisions, and drive business success. By understanding what good metrics look like, how to set them, and when to evolve them, product managers and data analysts can increase their positive impact on business outcomes.
Remember, numbers tell a story. Ensure your metrics tell a story that matters to your business. Happy analyzing!