When you’re building and selling a digital product, timely analytics can make all the difference. Understanding the ways customers interact with the app can help you fine-tune the experience you deliver. A/B testing of features and campaigns can guide optimization efforts to increase engagement and satisfaction. Insight into viral adoption patterns can inform where and how to invest marketing and social media resources. By translating data into knowledge throughout the product lifecycle, you can acquire the right customers, maximize their revenue potential, drive growth, and increase retention.
With benefits like these, it’s no surprise that the product analytics market is booming. In 2021, companies spent $9.3 billion worldwide on product analytics tools—with total revenue projected to reach $29 billion globally by 2028. However, these investments may not always yield the hoped-for returns. In reality, product analytics can only deliver a meaningful business impact if you can access the right insights at the right time, quickly and easily. And first generation product analytics tools fall far short of that requirement.
Let’s dive into a few reasons why no-code product analytics can be a game-changer.
What is no code analytics?
In a business environment where speed is everything, most product analytics tools are still architected as if teams have all the time in the world. Before you can even think about insights, you need to instrument your SDK to capture your data or build an ETL pipeline to load data from your cloud data warehouse into the vendor’s siloed black box. That’s especially challenging given the way data is stored in a data warehouse like Snowflake or Big Query, which call for a structure or schema that’s hard for legacy product analytics tools to ingest without extensive transformation. These time-consuming and resource-intensive projects will add weeks or months to your timeline. Even then, you’ve got to comply with their data model, not your own.
If the word “silo” sends chills up your spine, you’re right to be wary. Creating an alternate sense of truth invites no end of complications and confusion. Keeping both sets of data in sync will now be a constant concern to avoid issues resulting from data movement, data duplication, and irreconcilable differences, and an even greater challenge when you have to ask the vendor to make changes on their end and hope that they do it. As governance and transformation take place within the vendor’s environment, that data needs to be pushed back to your own data warehouse—for yet another copy of your data. Your security and compliance teams won’t be happy about that loss of control either.
Higher storage costs add insult to injury. With a pay-as-you-go cost model, companies often worry about event volume, leading them to either sample or cut back on the different events they are capturing with the product. That limits the amount of analysis they can perform.
All that extra effort and cost might be worth it if you ended up with the product analytics tools of your dreams—but no such luck. Instead, you face additional delays and friction every step of the way. Want to build a dashboard? Add a table and backfill data? You’d better not be in a hurry. Meanwhile, product teams have no idea what’s actually happening inside that black box—how their queries are being run, how the resulting insights are being derived, or even whether the vendor understood their request in the first place.
When you’re spending millions on customer acquisition, going head-to-head with fast-moving competitors, and trying to retain customers in constantly shifting consumer markets, you need fast access to insights you can trust. That calls for a new approach to product analytics.
The benefits of no code analytics and dashboards
The architecture of traditional product analytics tools might have made sense in the past, before companies developed their own metrics collection capabilities. These days, they want the flexibility, security, and control that comes with building their own data stack, complete with a modern cloud data warehouse. When you have your own environment, why should you have to move your data anywhere else?
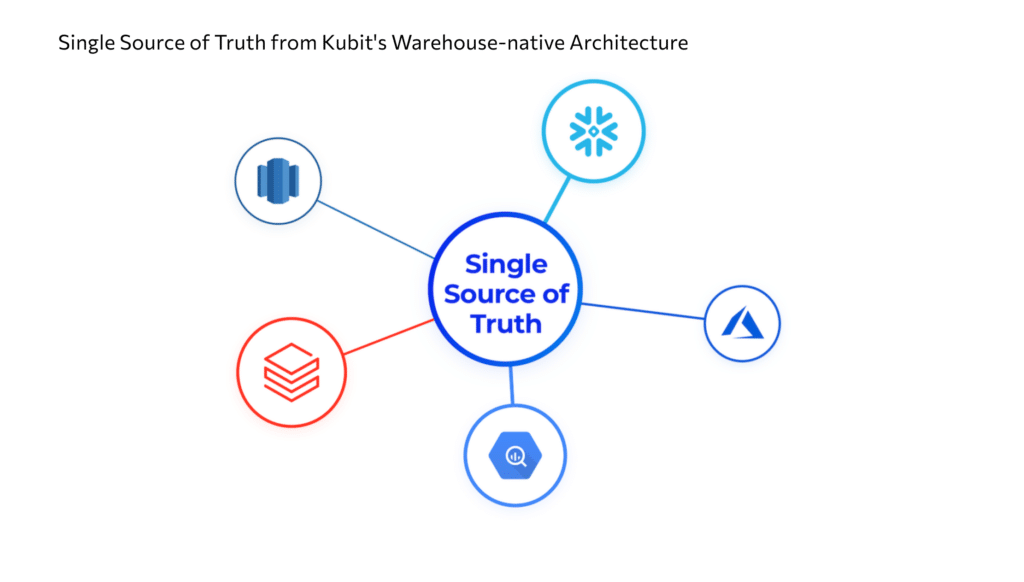
No-code product analytics is built for the way companies capture and use data today. Instead of having to move your data to a vendor’s environment, and deal with all the resulting silo costs and headaches, a new generation of solutions let you connect the vendor to your live data right where it is, in your own cloud data warehouse. That means you can skip all that SDK and ETL business while maintaining a single source of truth that eliminates the need to coordinate data backfilling or scrubbing across multiple copies. Just as importantly, you know exactly how your data is being secured because you’re doing it yourself—and the ability to share data as read-only, with control over which columns to share or mask, makes regulatory compliance a lot easier too.
For users, no-code product analytics replaces inefficient workflows with direct control over both data and queries. Analysts can see exactly how each analysis is constructed, and can add new dimension tables, data, and properties as needed without a lot of time-consuming back-and-forth or development work. Queries can be performed on complete data, not just a sample, enabling more accurate and comprehensive insights. Results can be compared easily with other data in the cloud data warehouse for deeper understanding. As a result, analysts can get fast answers to key questions like:
- Which product features are customers using most often—and which are they overlooking?
- Where in the user journey do we tend to lose the most customers, and why?
- Did a recent campaign bring in customers with high lifetime value or better retention, or should we rethink our targeting?
- How long is it taking people to perform various tasks, and how did this change in our latest update?
As customers demand more personalized experiences and recommendations, digital competition continues to intensify, and data becomes a key differentiator, the importance of product analytics will only grow in the coming years. Product teams need to escape the limitations of traditional tools and embrace a faster, simpler, more flexible, and more secure way to access insights. Designed for cloud-native speed and agility, no-code analytics can help businesses make the right decisions at the right time to improve engagement, increase retention, drive growth, and succeed in the modern digital marketplace.
How to create a no code dashboard using Kubit
When the term “no code” dashboard is used it typically refers to the users ability to use a software platform that allows them to create dashboards without writing code. Kubit’s easy-to-use UI facilitates the ability to build robust dashboards without writing a line of SQL. Within Kubit you simply begin by building an analysis using our out-of-the-box report types (Query, Data Tables, Path, Funnel or Retention) and develop the metrics you want to visualize over time. Once each report has been created add those items to a Kubit dashboard and share with your teammates.
Once information has been added to a dashboard in Kubit the owner of the dashboard is able to modify the layout, adjust the order of the reports and add rich text blocks to enhance the understanding of the information presented. The ability to not only build but customize a no code dashboard should be a strong requirement when searching for the best tool. Adding context and storytelling elements increases comprehension and adoption of these tools for those less technical users.
Taking it a step further, in Kubit you’re also able to apply temporary filters on no code dashboards to bolster the team’s ability to self-serve. Let’s say a dashboard was created for all platforms of an application, however the teams are organized based on platform and only care to see this information for their specific one. With functionality like dashboard filters, these users can apply the platform filter and see information relevant to them without having to build a dashboard of their own.
Organizations that rely heavily on engineering tasks or backend queries can potentially find value in code based dashboards however this can create bottlenecks. If an organization is truly looking to adopt self-service analytics taking the no code dashboard approach and a platform that can be used by both programmers and non-programmers, can help streamline the dashboard creation process. No-code dashboards can be useful for visualizing key data and presenting it in an easy-to-digest way.
Example of no code analytics and dashboards
Here are a few examples we’ve seen of dashboards created for various use cases.
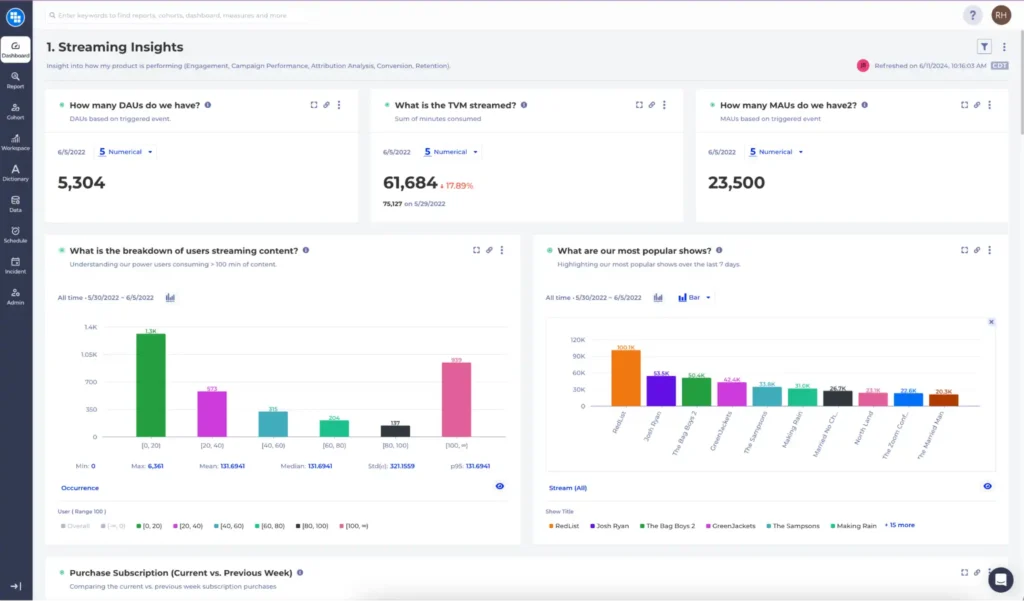
Streaming Media
Companies that deliver streaming media have very specific metrics they need to keep track of daily or in some cases hourly. These dashboards typically include metrics like:
- Total Viewing Minutes/Hours
- Average Viewing Minutes/Hours per Visitor
- Total Active Visitors
- Average Sessions per Visitor
- Total Viewing Minutes/Hours per Session
Often these metrics should be segmented by things like Subscription levels, Content Categories, Streaming Types (Live vs. VOD). Leveraging a no code dashboard enables product and content teams to understand how top metrics are performing, without writing or requesting code to be written.
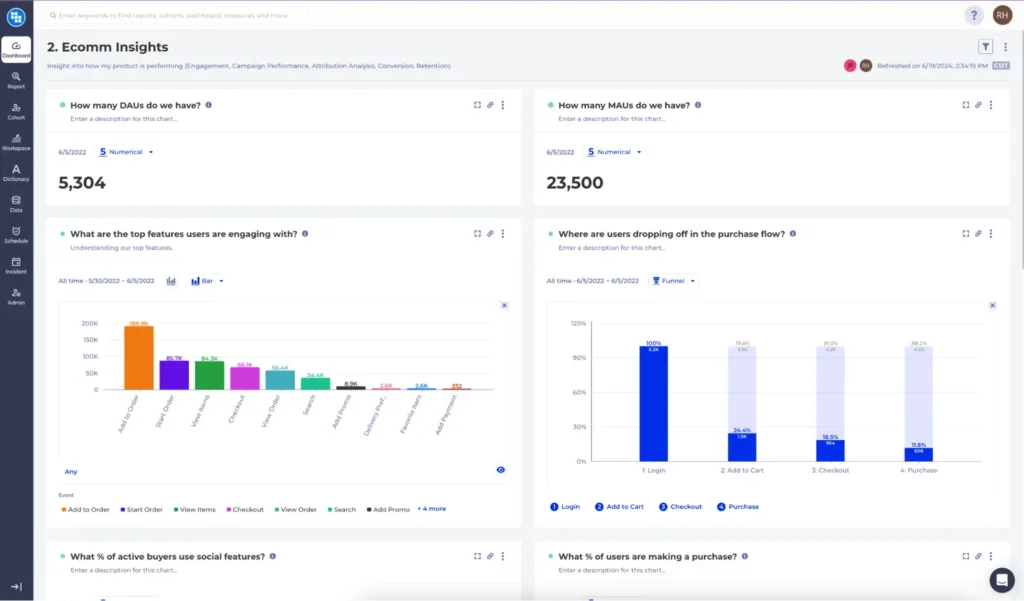
E-Commerce
E-Commerce use cases tend to favor funnels, paths and shopping cart type analysis to better understand if the platform is successfully converting visitors to buyers. When using a no code dashboard a team is able to quickly spin up several dashboards focused on each major area of engagement and purchase behavior. This typically takes the form of:
- Total Purchases per Day
- Average Order Value per Cart and Visitor
- Loyalty Program Sign Ups
- Marketing Attribution tied to Check Out Conversion
- Conversion Rate of Search to Check Out
Often these metrics should be segmented by things like purchase history, device type, country and loyalty program enrollment. Leveraging a no code dashboard enables product and content teams to understand how top metrics are performing, without writing or requesting code to be written.