When analyzing data, analysts often need to compare various measures simultaneously and break them down by different properties and segments. Introducing Kubit’s latest analysis chart, Data Tables, which allows for multi-measure, multi-dimensional analysis in a single view.
Tools like Excel and Sheets have provided this type of data visualization and it works! While you may still want to see data in funnels, lines, bars and pie graphs; it can sometimes be best to see it laid out in a table view.
Our Customers are using Data Tables to understand things like:
- Cross Tab Analysis
- How are User engagement metrics across different user segments and features?
- Custom Measures and KPI Analysis
- Compare custom-defined measures or KPIs across different dimensions
- Segmented A/B Testing
- Analyze user segments by control vs. variant groups
- Impact of Marketing Campaigns
- Show click through rate, conversion rate by user segments and Campaigns all in one report
Getting Started with Data Tables:
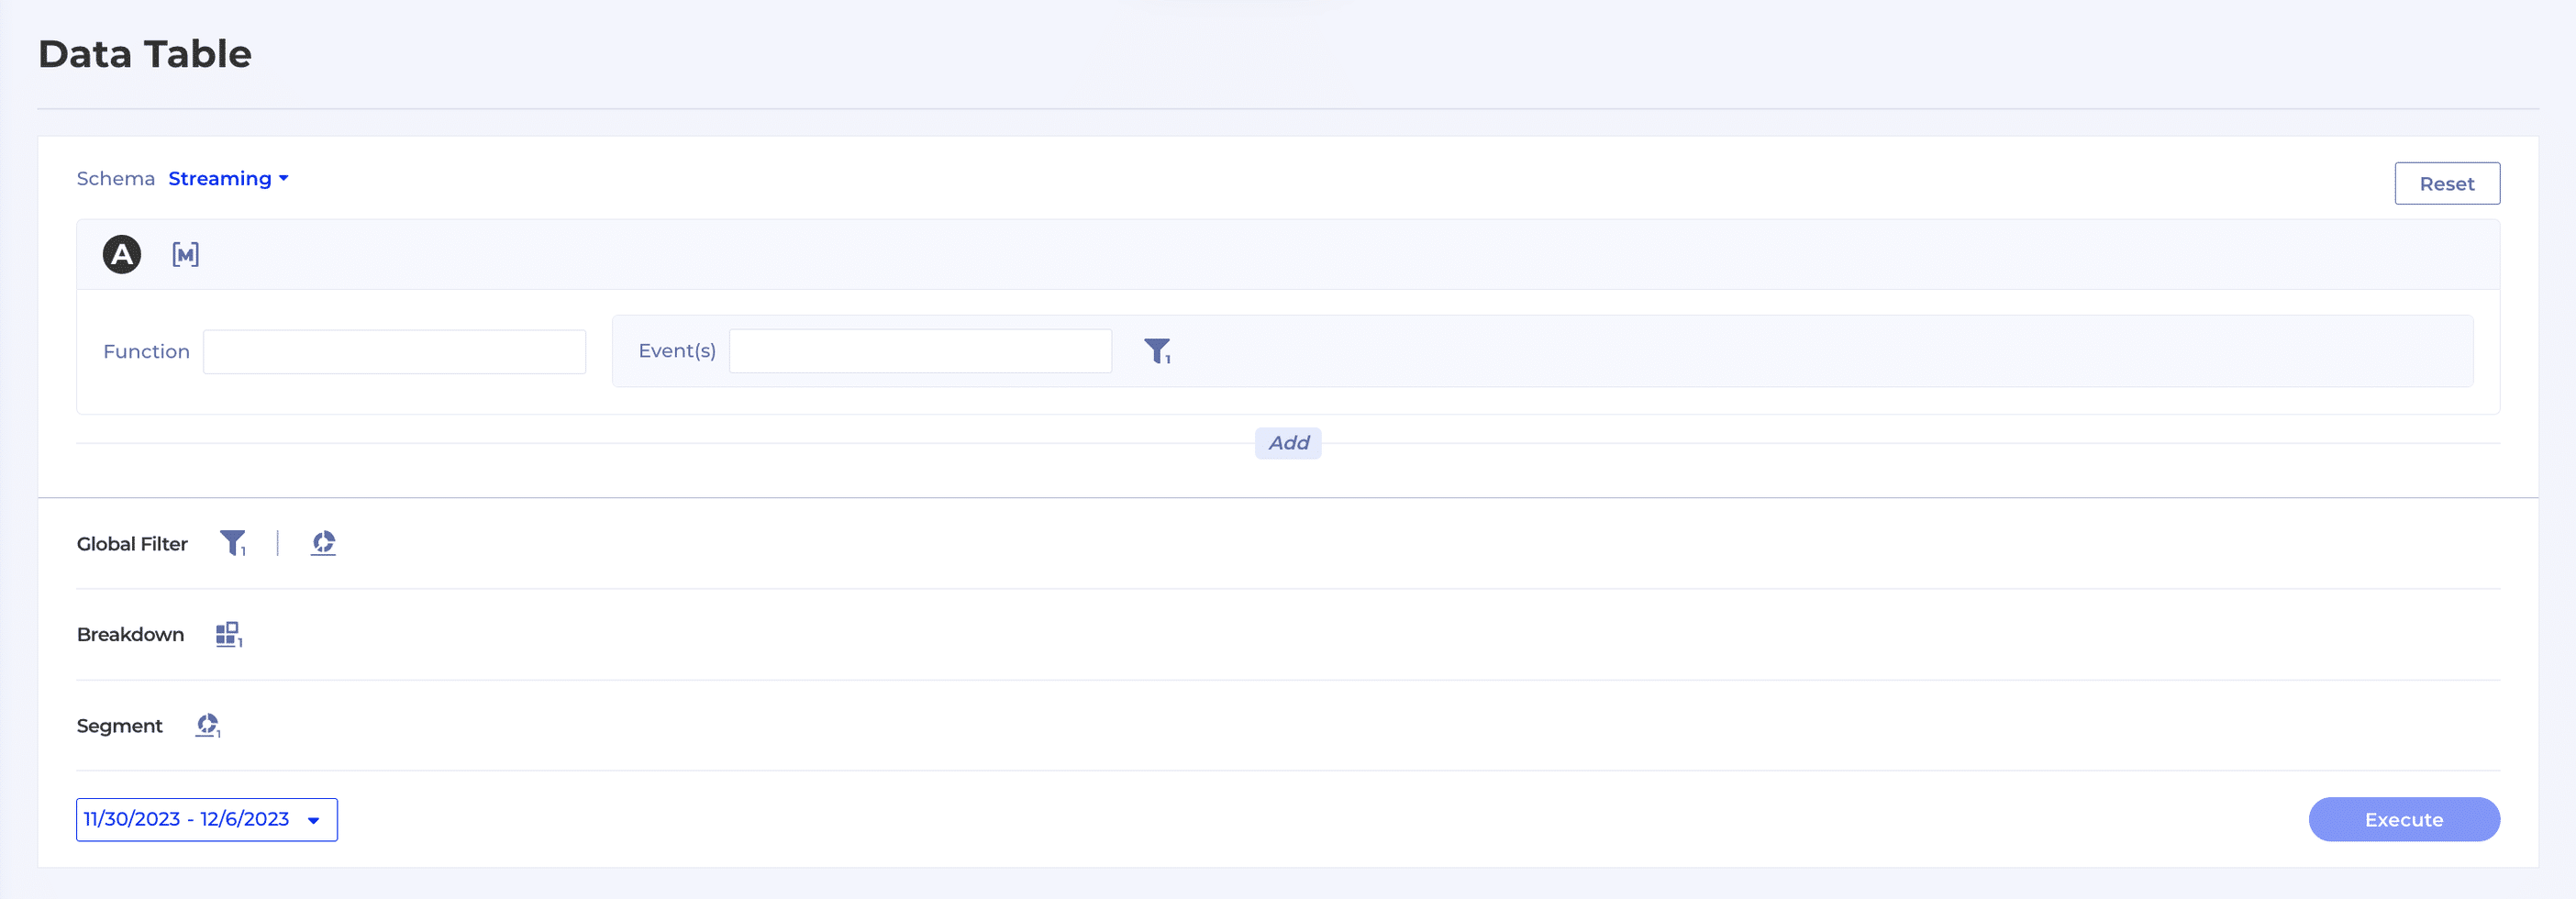
- Navigate to Report → Data Table.
- As you can see from the snapshot below, the end user can easily begin adding new events, saved measures, breakdowns and segments.
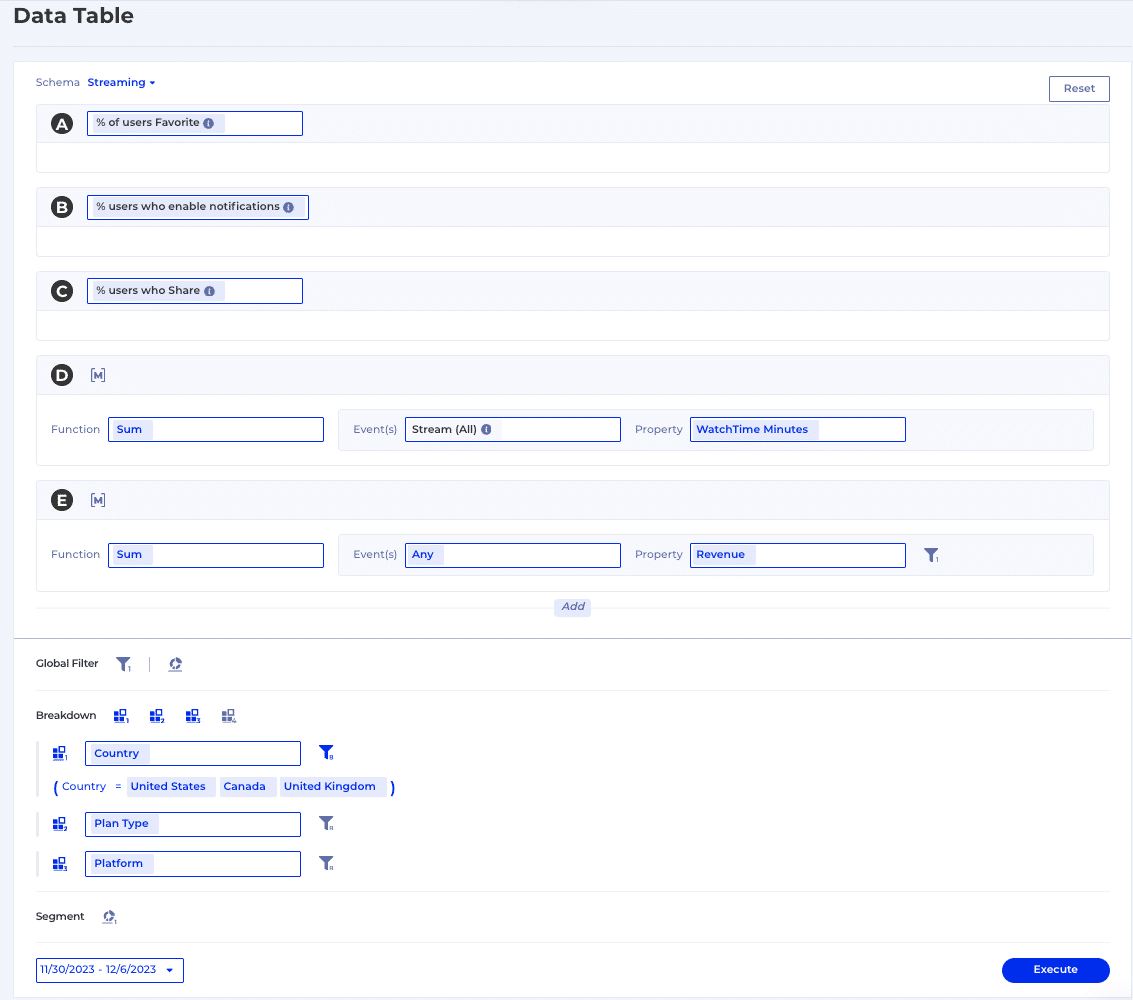
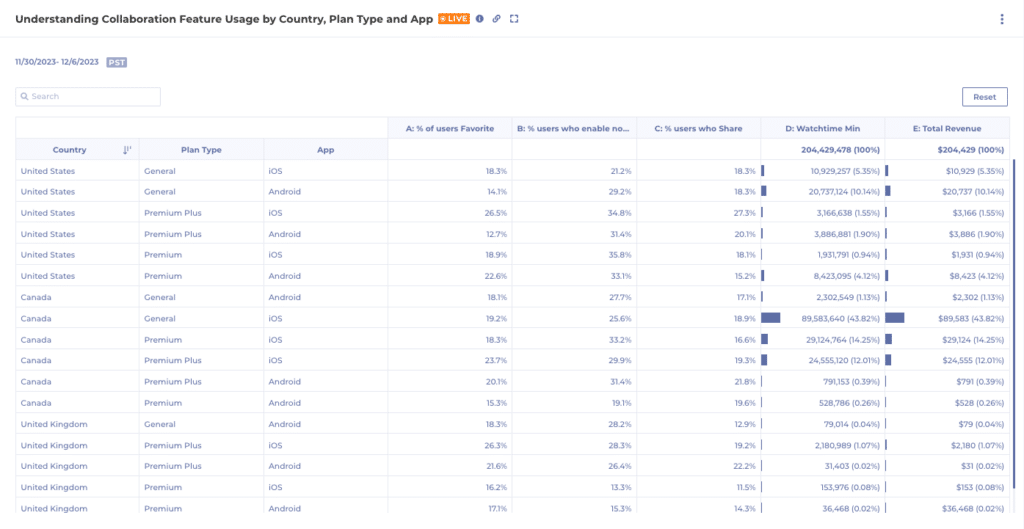
- Highlighted below is an example of a user selecting 3 saved measures, building 2 measures on the fly and breaking it down by Country (United States, Canada, United Kingdom), Plan Type and Platform.
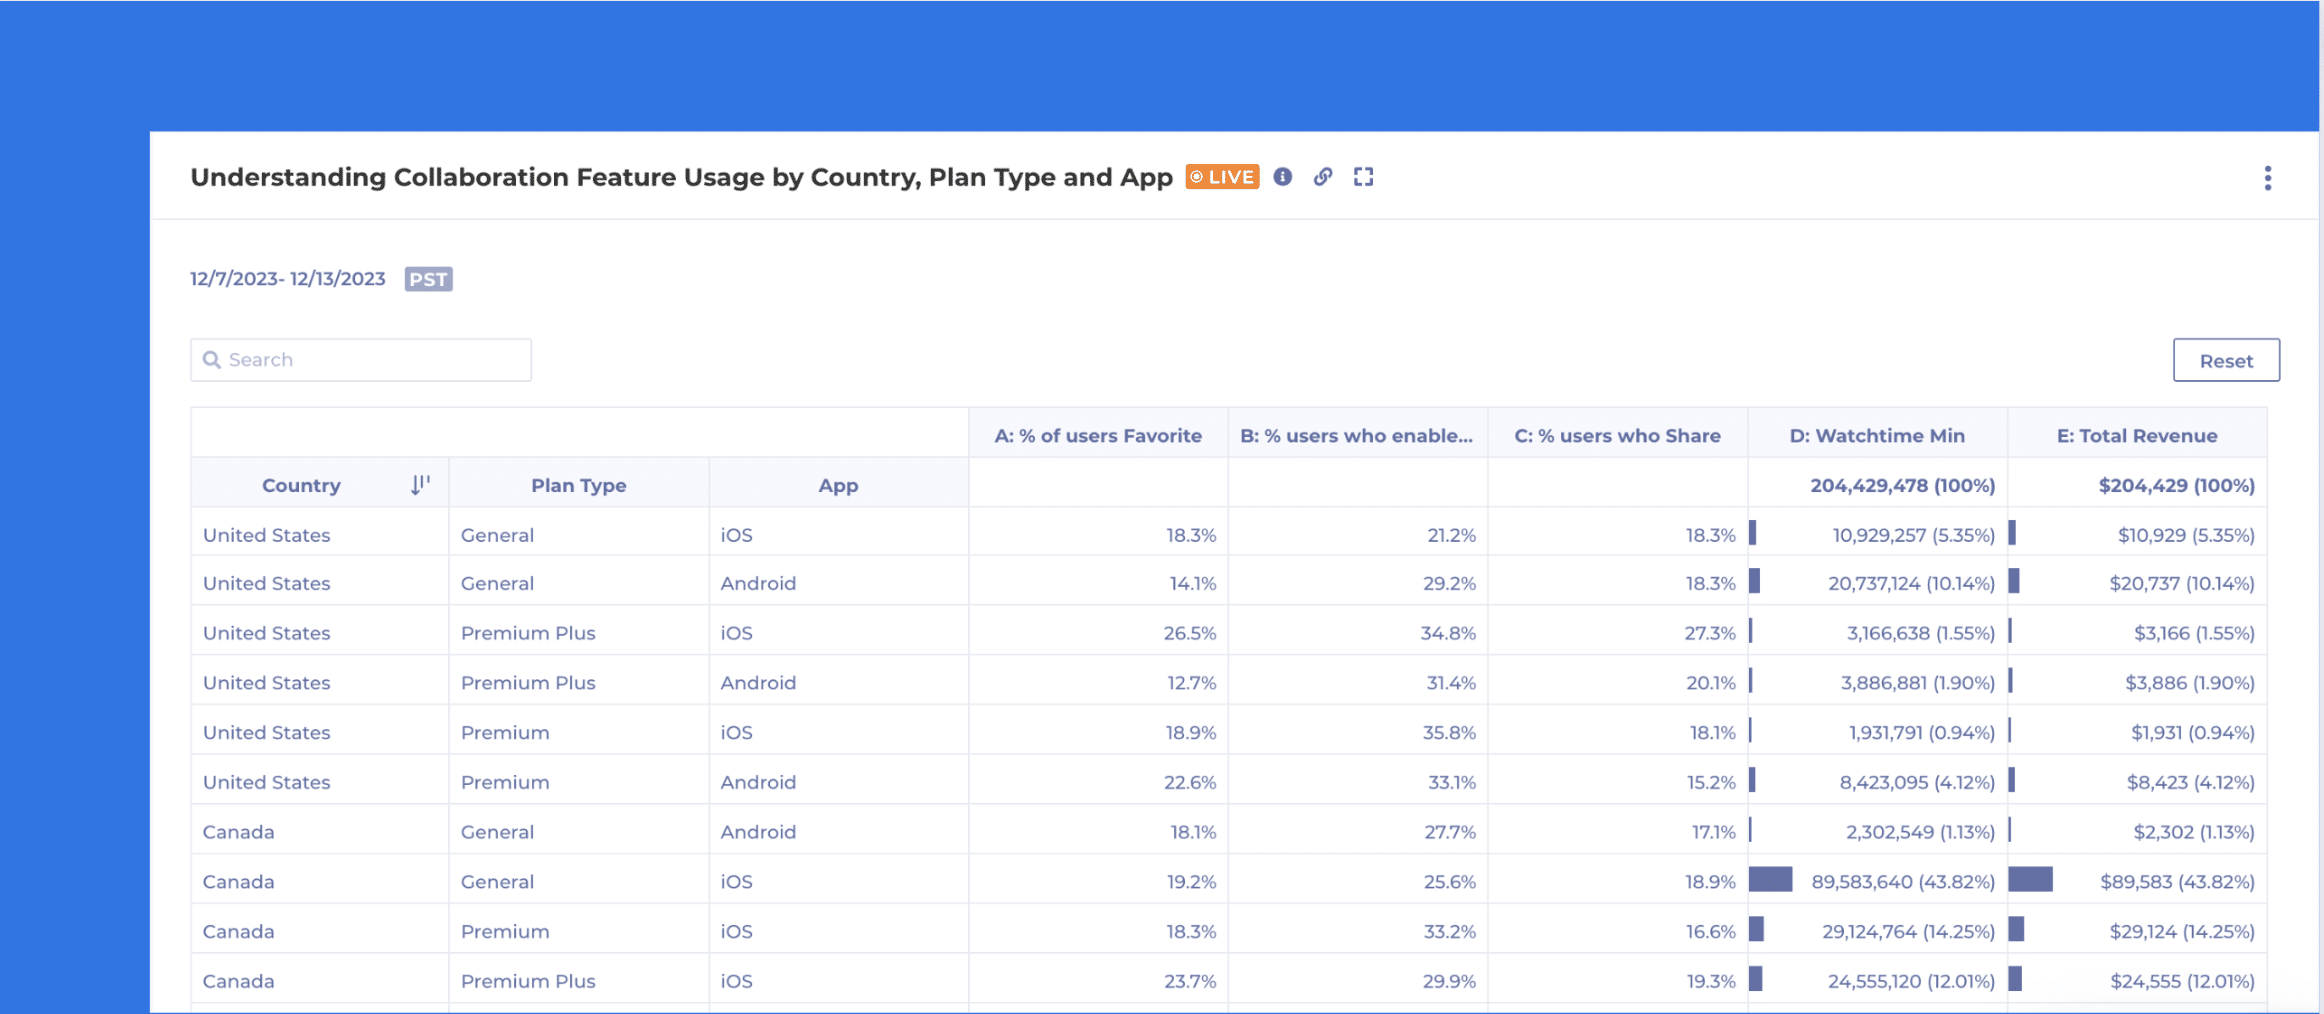
- When executed, the below table will be displayed. Users have the ability to sort, search, adjust columns widths, export to CSV, and view the SQL behind the chart.
Take it for a Ride
Now that you have a high level overview of Kubit’s Data Table, click through the guide below and get a feel for it yourself. If you’re interested in learning more, please reach out to our team.